

Last week gave us a very strong week for the QQQ and SPY as both finished with large bullish candles after strong hammer candles the week before. Hammer candles on the weekly chart are usually something to pay attention to, especially when they appear at key levels, which this one did at the 100-day SMA on the QQQ.
Not much has changed since my Thursday analysis. Friday gave us a small bullish candle and pushed higher, but the door is still very much open for a consolidation week this week or a continuation of the trend. The QQQ is pushing into new ATHs while the SPY continues higher in price discovery. If we get a Monday gap, that should set the tone for the week.
QQQ Daily Chart

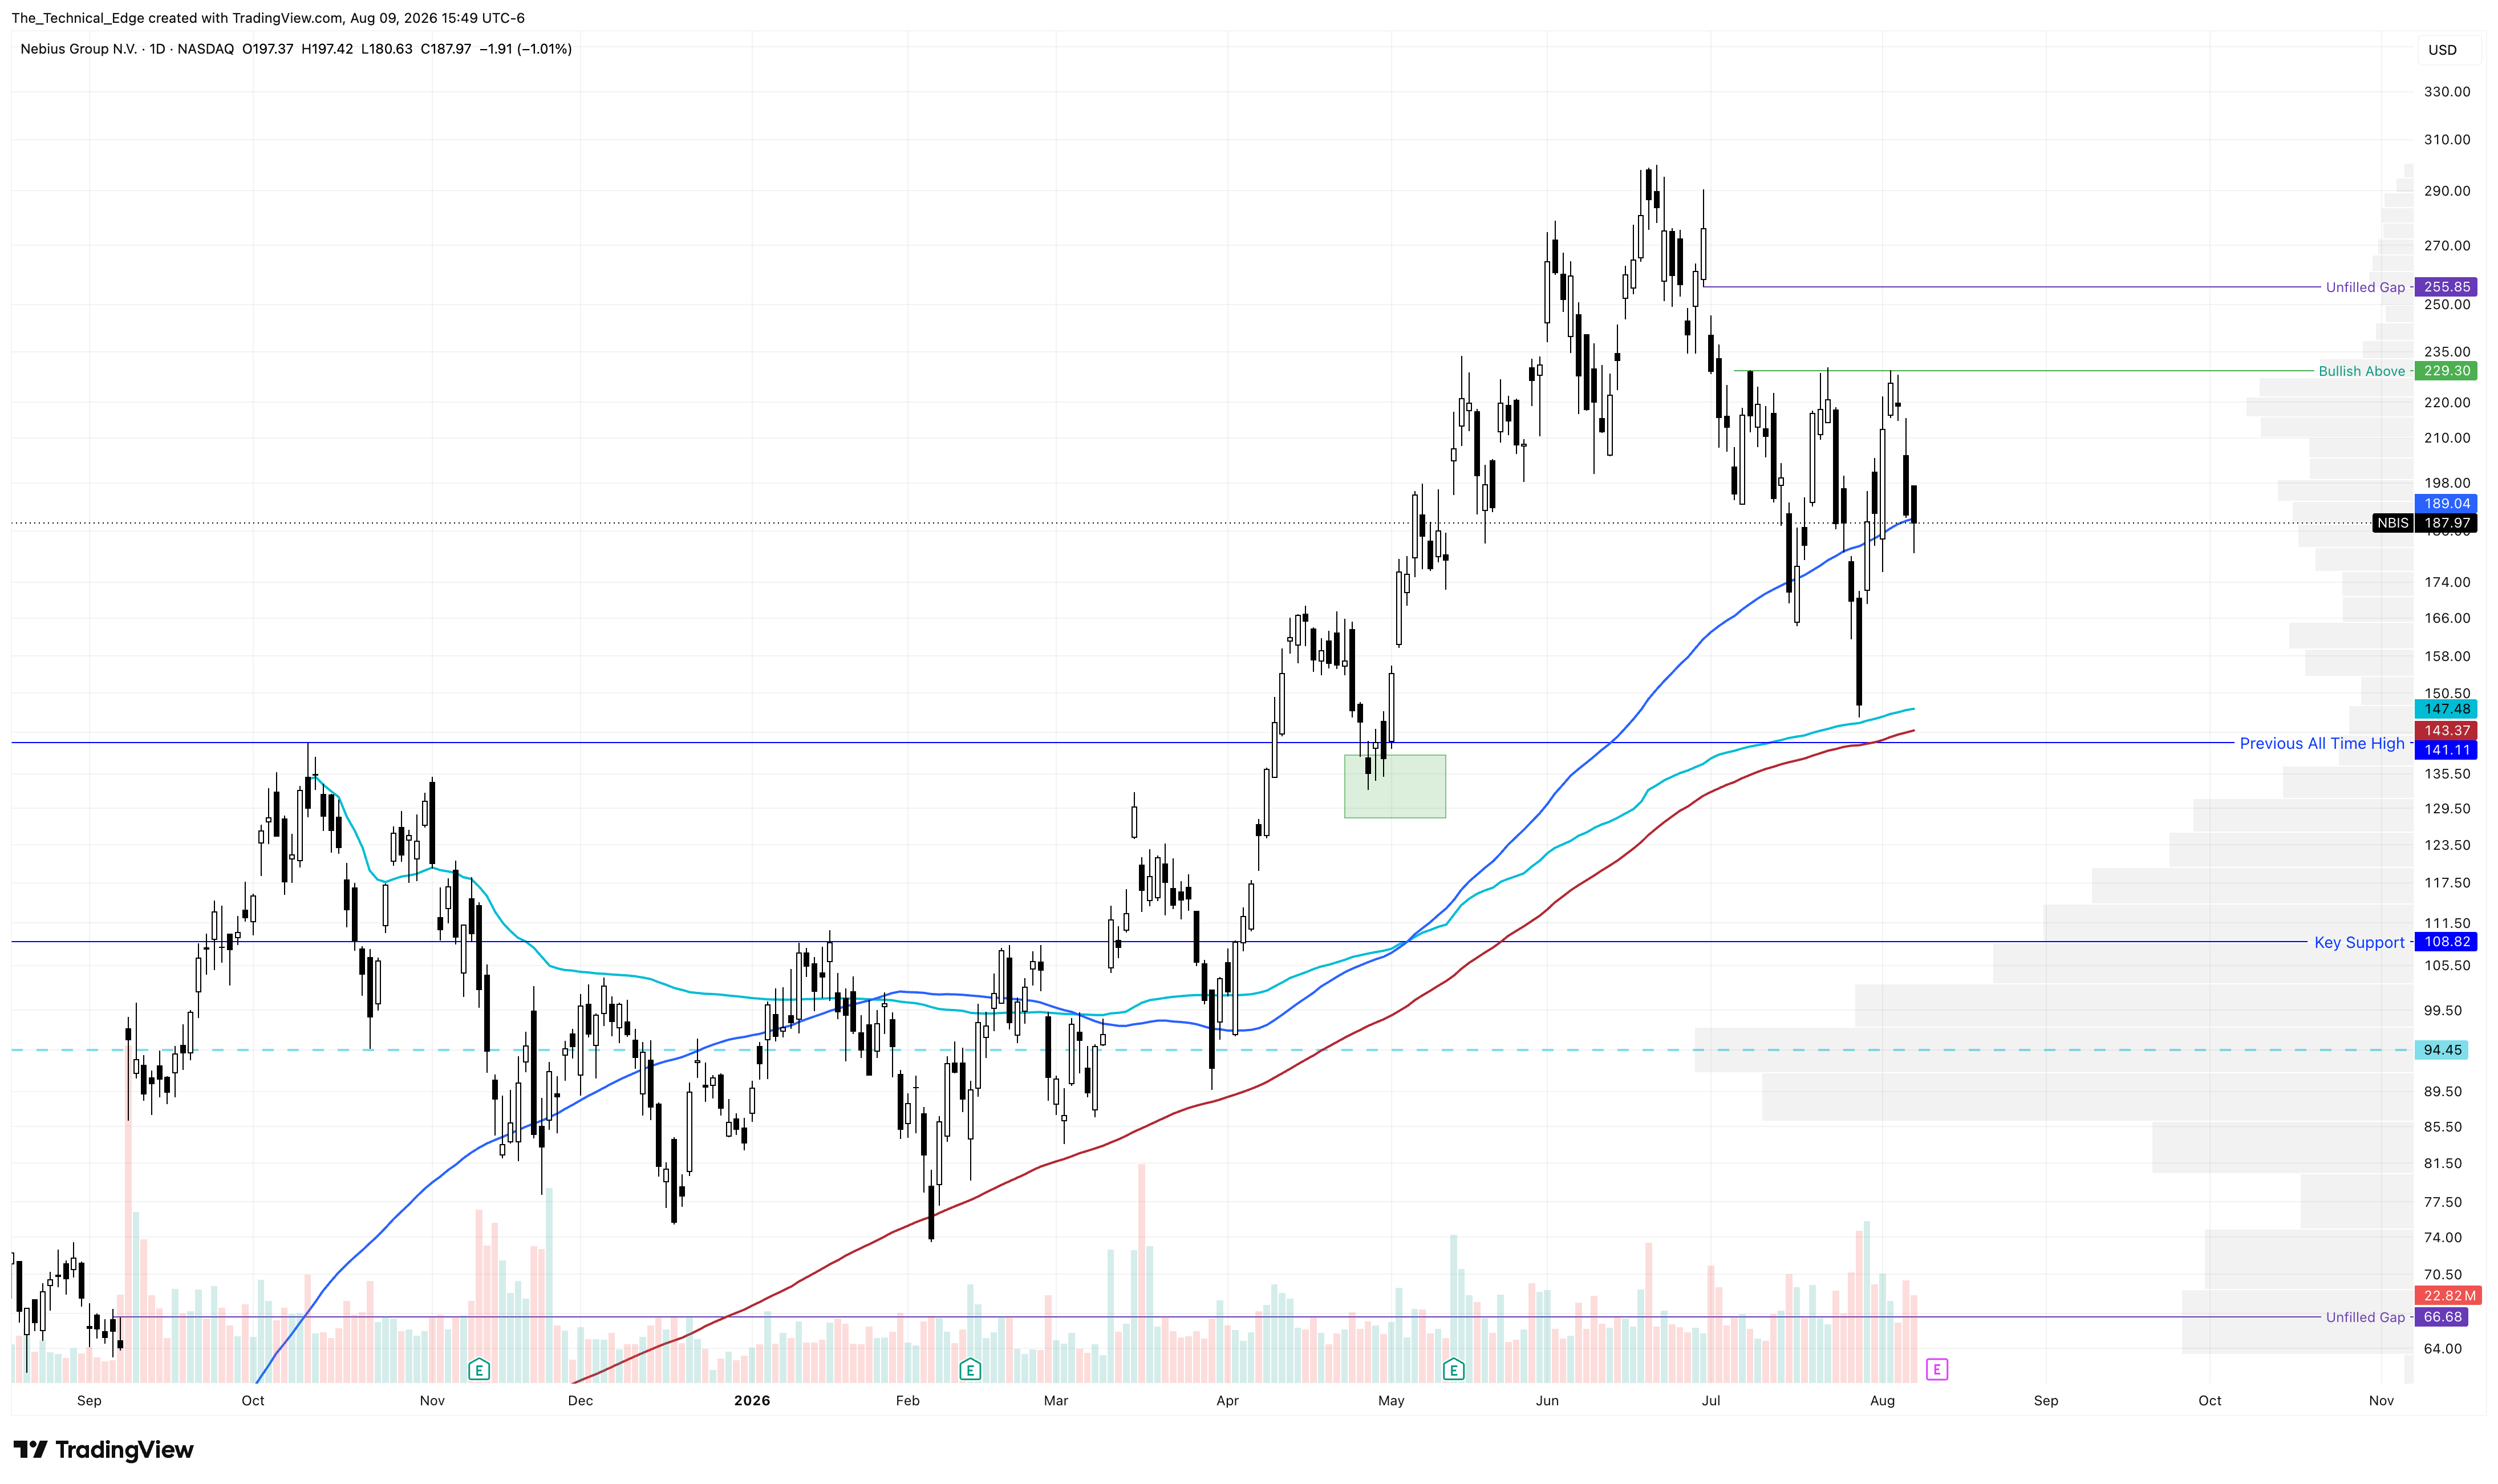
It is not too crazy of an earnings week, with no really big names reporting. We do have some of the retail favorites reporting this week, and I am sure there will be fireworks in some of the wildest high-beta names like RKLB, ASTS, SMCI, HIMS, QUBT, CRWV, LITE, FLY, and NBIS.
NBIS Daily Chart
It has been a crazy earnings season so far, with many incredible gaps to play. In Friday’s After Swing Room, linked below, I go through some of my favorite gap plays for you to keep an eye on.
A few of my favorite setups going into next week are HOOD, TXN, CVX, IBM, and AAPL. I do review each of these in the swing trade video, and I have featured each of them in this newsletter over the last week or so, so I will review CVX, which I have not discussed yet.
CVX just closed below the 100-day SMA after flirting with that support all last week. Right now, oil is a big deciding factor in which direction the markets are heading. When we look at crude, it broke down below the 100-day SMA but may be trying to find support at the 200-day SMA.
If crude can break down below the 200-day SMA, that would signal the market is no longer fearful about the war in Iran’s effect on oil prices, at least for the time being. That would give the market room to push higher, perhaps into the next rate decision in September.
CVX is the cleanest chart that gives me a way to play that thesis. It has a double top that stopped right at the $197 resistance and is now breaking down. If it can get a few nice selling days, the next support is around $177 and the 200-day SMA.
I trade a lot of tech names, and I like when I have a trade that I feel will work if the markets draw down. That was the cool part about my XOM trade off the 100-day SMA in late June. However, this trade is right in line with my bullish thesis on tech, so if oil pops higher, pushing CVX higher and the markets lower, all of my trades get hit at the same time, which is not ideal.
CVX Daily Chart

However, the technicals were solid, and I have had a great start to August, locking in some massive wins. It feels like the best time in a few months to push my edge a bit, so I am going to see where this one can go.
The worst that can happen is I lose an R, right?