


Do you all remember Thursday, when I wrote a full newsletter explaining why Thursday’s candle should mark at least a short-term low? I also said that if it didn’t, that would be a warning signal for the markets. Whenever we get a strong candle at a key level with strong volume, you don’t want to see that candle break in the following week. But a very next ay breakdown?! That spells trouble.
The bears have shown up, and they showed up hard! Friday’s candle kneecapped the bulls, closing below key levels across the board on massive volume. The only hope for Friday’s low holding is that we get a scenario similar to July 29 2026, when the market formed a bear trap. If Monday gives us a gap and go above the 100-day SMA and closes fully back above Friday’s candle, consider Friday a trap. No matter what, we need to reclaim the 100-day SMA early in the week, within the next two, maybe three days based on past historical price action. Otherwise, the likelihood of QQQ hitting its 200-day SMA increases drastically.
That said, the move lower probably won’t be a straight shot down. At least, that’s not the most likely scenario. If we look back at the most recent breaks and closes below the 100-day SMA, we can find several examples of how this might play out.
QQQ Daily Chart

A Look Back in Time
July 29, 2026: The Bear Trap
This was the most recent break below the 100-day SMA, and it turned out to be a bear trap. Price closed below the 100-day SMA before reclaiming it the very next day. This is the type of scenario the bulls need to see again if they want to avoid a deeper correction.

February 4, 2026: The Start of a Deeper Correction
Earlier this year, the February 4 candle started the final leg of the drawdown. Price bounced toward the 100-day SMA for several weeks but couldn’t break back above it. Eventually, the market sold off into a 10% correction before resolving higher. I think this type of price action makes a lot of sense as a potential analog for today, given the similarities in the patterns we’ve seen develop.

February 27, 2025: The Breakdown Before Liberation Day
This candle closed strongly below the 100-day SMA, retested the moving average from below the next day, and then pushed lower into the eventual crash surrounding Liberation Day. This is a reminder that a failed retest of the 100-day SMA can be a warning that more downside is coming.

September 6, 2024: A Quick Reclaim Marks the Low
This candle broke strongly below the 100-day SMA after two bullish candles had closed just beneath it. It was a bearish setup, but the candle actually marked the low. Price formed two inside bullish candles, then closed back above both the 100-day SMA and the bearish candle two days later, with increasing bullish volume.
One important detail here is that the market had tested the 200-day SMA the month before. This example reinforces the importance of quickly reclaiming the 100-day SMA if the market is going to establish a more durable bottom.
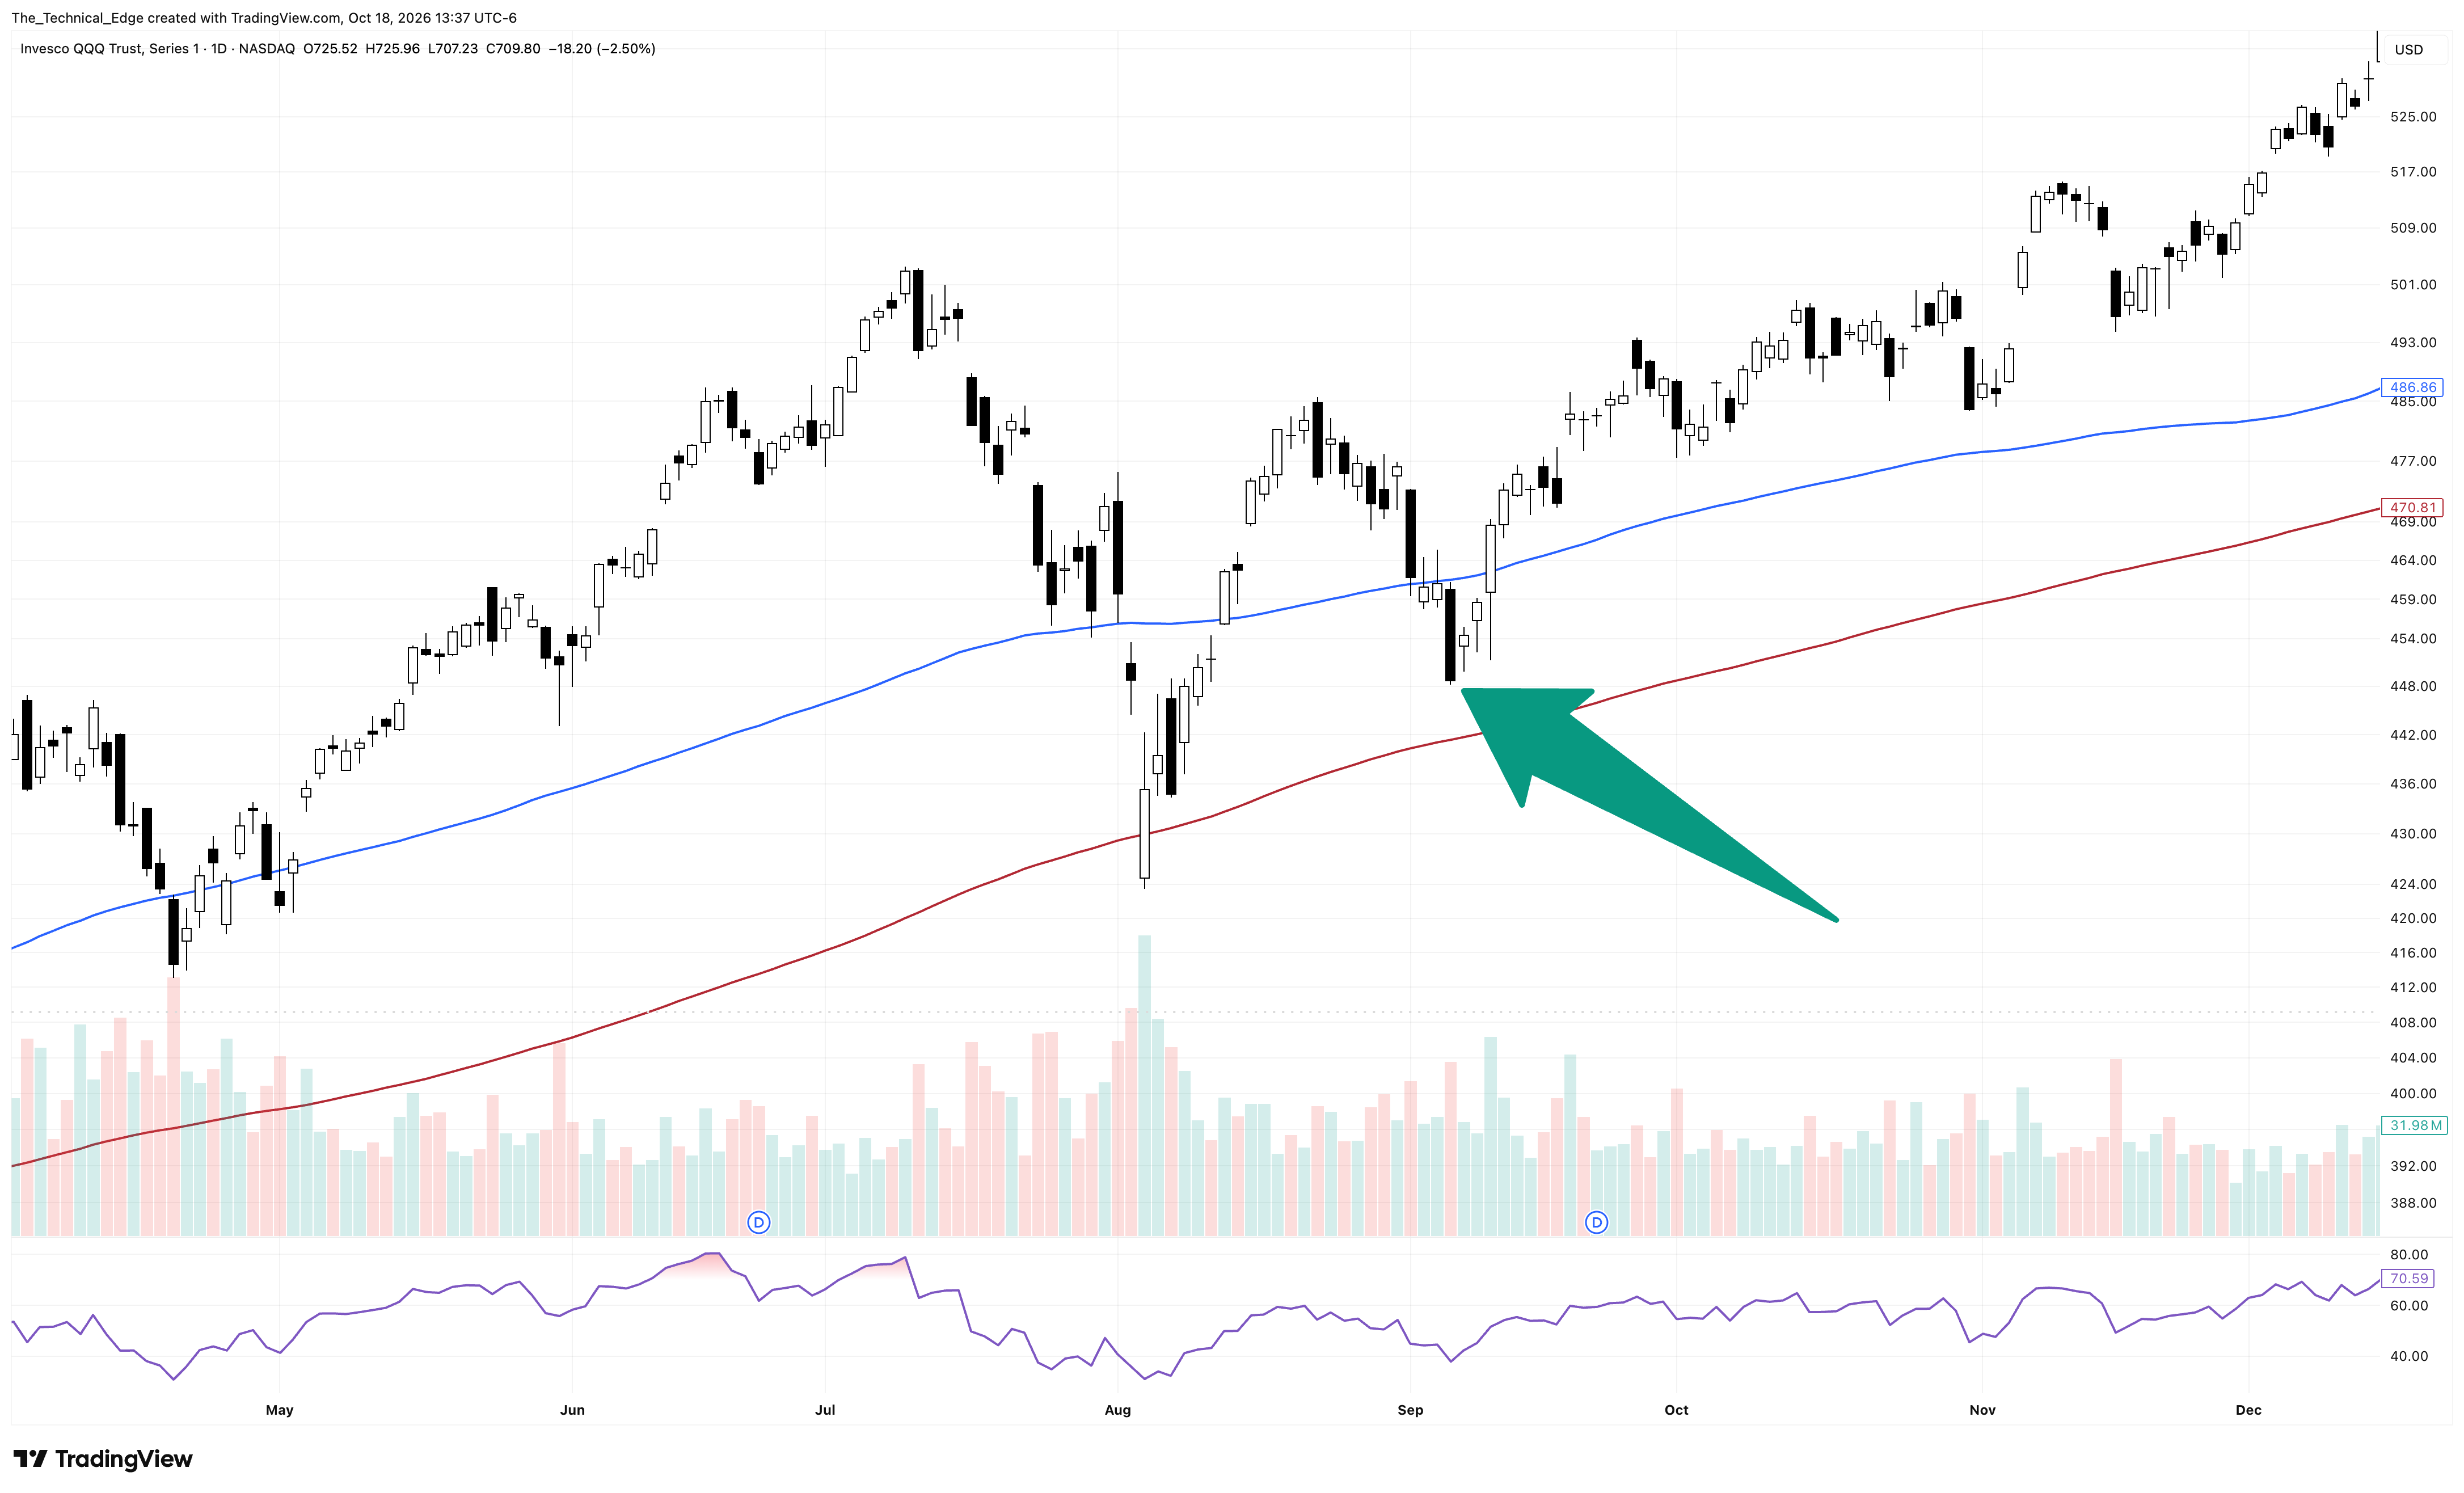
August 5, 2024: A Gap Down and Capitulation
This was the prior time price closed below the 100-day SMA, and it was a particularly ugly setup for the bulls. The market gapped below the 100-day SMA, which is always a bad sign. That move led to a 7.5% drop over just two candles, pushing price into the 200-day SMA. The following day brought another 5.42% gap down, making this a good case study in gap-down capitulation.

April 19, 2024: Another Quick Reclaim
Price closed below the 100-day SMA, formed one inside candle, and then closed back above the moving average the next day. Once again, this reinforces the idea that if the bulls are going to turn a breakdown into a bear trap, they need to step in quickly and reclaim the level within the next couple of days.

September 21, 2023: A Longer Stay Below the 100-Day SMA
This time, price also gapped below the 100-day SMA. Rather than quickly reclaiming it, the market spent several weeks below the moving average, filled the gap, and then rotated lower toward the 200-day SMA near the end of October before finally finding a durable low.
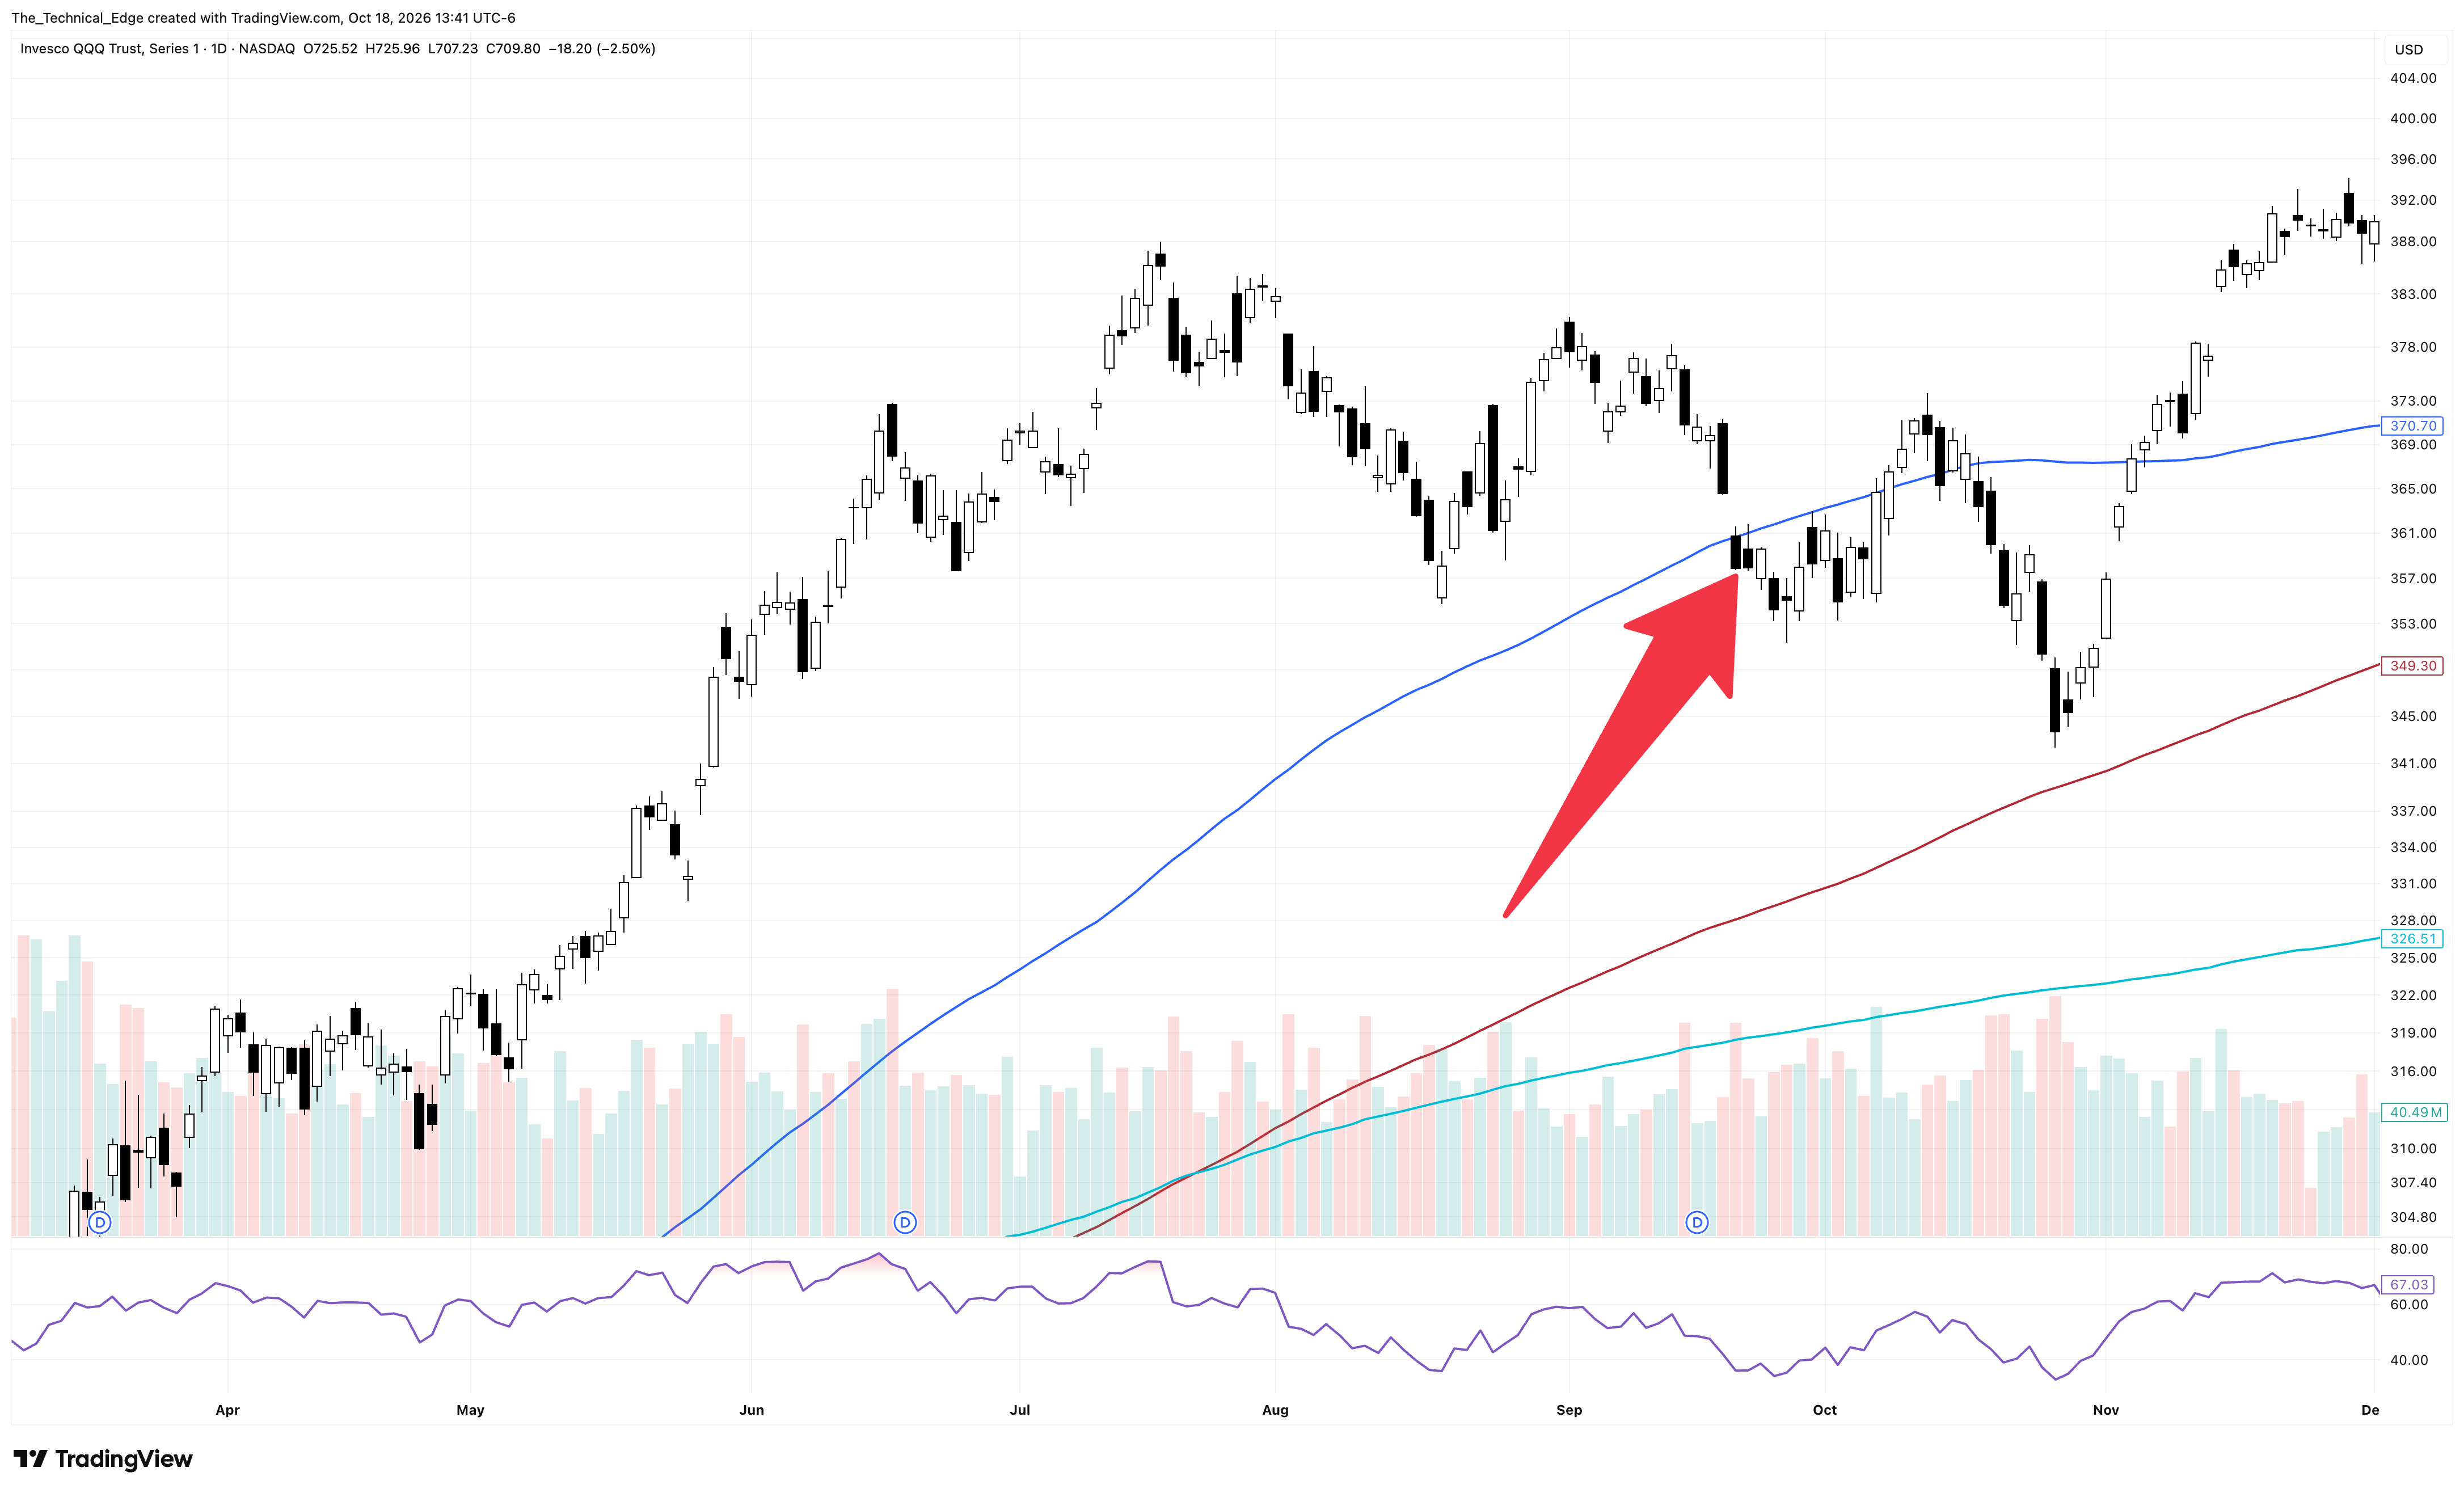
Those are the seven key breaks below the 100-day SMA since the 2022 bear market lows. In four of those examples, price continued lower toward or below the 200-day SMA. In the other three, price quickly reclaimed the 100-day SMA. Essentially, the initial close below the 100-day SMA is less important than what happens over the several days that follow.
We can go back even further and find many more examples that fall into one of these two categories.
Either price quickly reclaims the 100-day SMA and avoids making significantly lower lows, as we saw on October 4, 2021, May 12, 2021, March 4, 2021, and August 5, 2019.
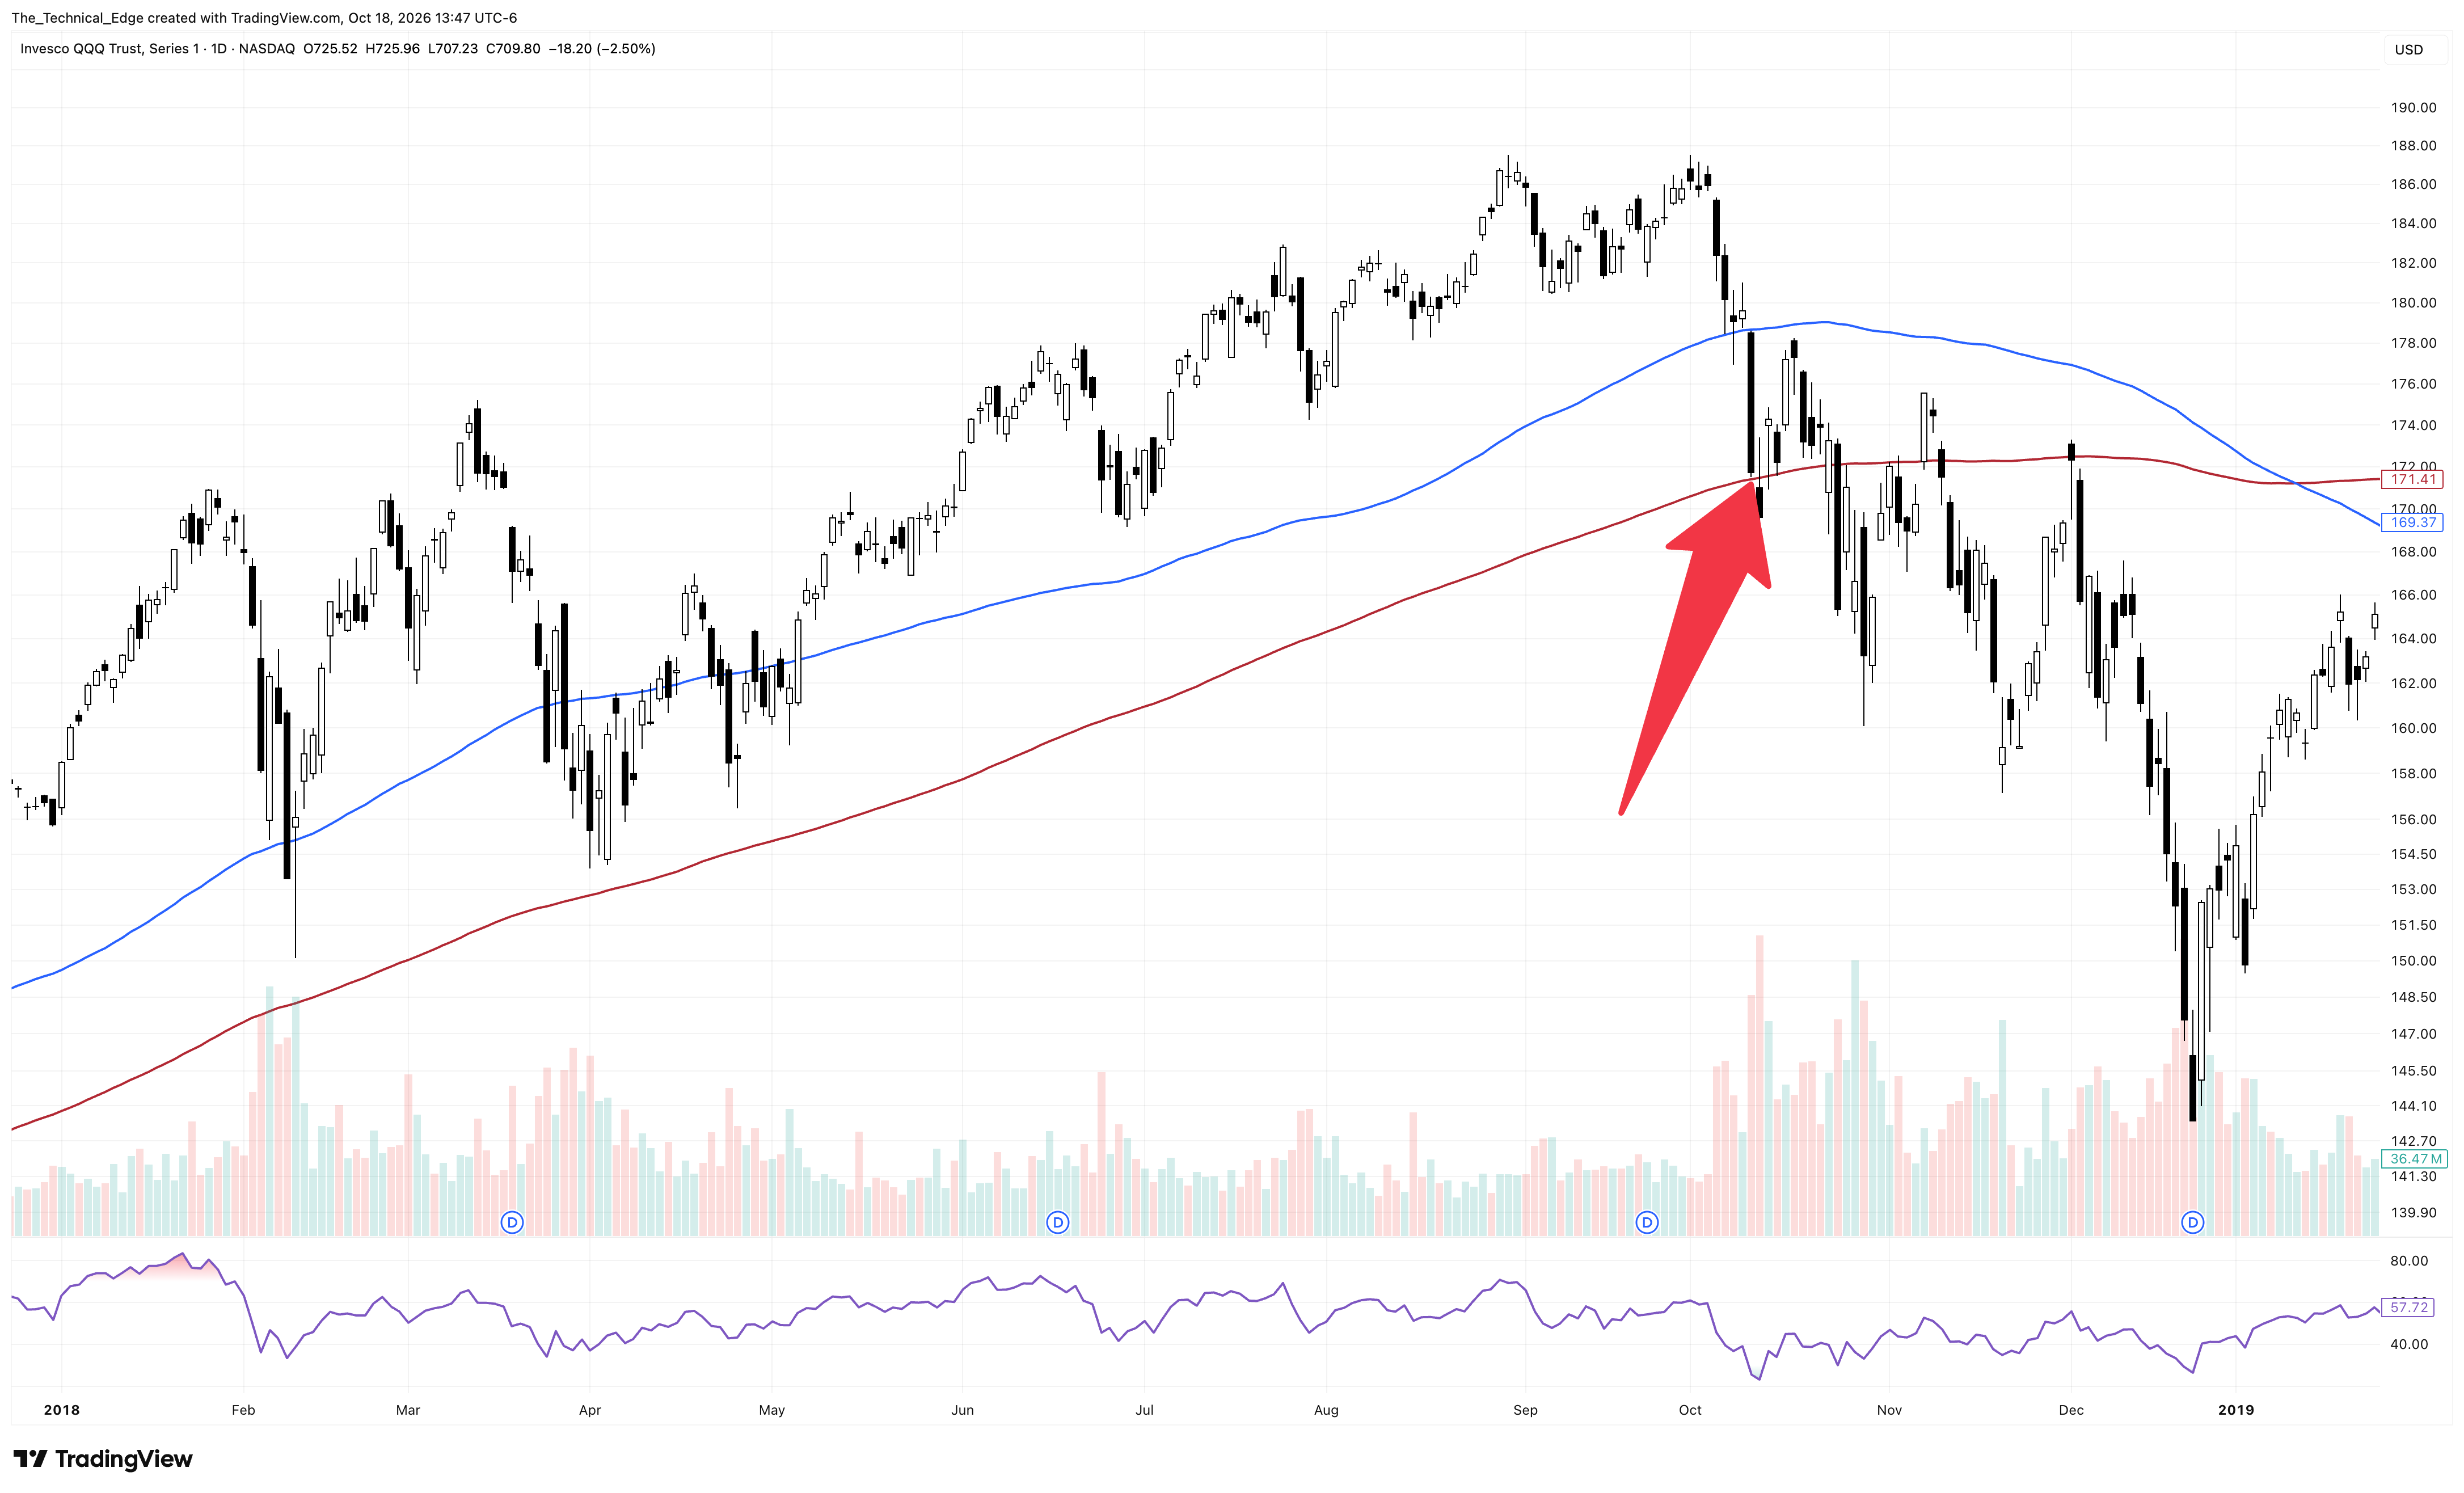
Or price spends several days below the 100-day SMA, fails to reclaim it, or briefly gets back above it before breaking down again. These scenarios often lead to new lows and a move toward the 200-day SMA. The October 10, 2018, breakdown is an interesting analog to today’s price action in several ways, from the technical setup to the broader macro landscape, including the fact that both periods fall during Trump’s first midterm year.
What Comes Next?
Given how many key levels broke across the board on Friday, its less probable that this is simply a bear trap. However, many charts are extended to the downside, and we likely have significant liquidations contributing to the selling pressure. That means we could still see some large snapbacks in price this coming week, even if the broader correction isn’t finished.
Whatever happens this week, I expect volatility and some big moves. In the best-case scenario, in my opinion, we get a waterfall move lower for several days, resetting prices in semiconductors and AI names, spiking fear, and ultimately setting up the broader market and multiple sectors for a run higher into the end of the year.
Once again, my analysis suggests this dip should be buyable. The question is how deep we go before finding the bottom.
SPY down to $700 would fit the New Rate Hike Regime model, but that would require a bigger pullback that I am currently anticipating. Anything is possible, and that would be a prefect retest of the prior all time high, which should happen eventually, but that is not my base case right now.

Instead, I think SPY in the $740 to $726 range and QQQ in the $675 to $655 range over the next few weeks make a lot of sense as potential downside targets.
The big thing I’m watching is whether the market can reclaim the 100-day SMA quickly or whether we spend several days below it.