
Bitcoin Bulls Turning Bearish
RLT Newsletter


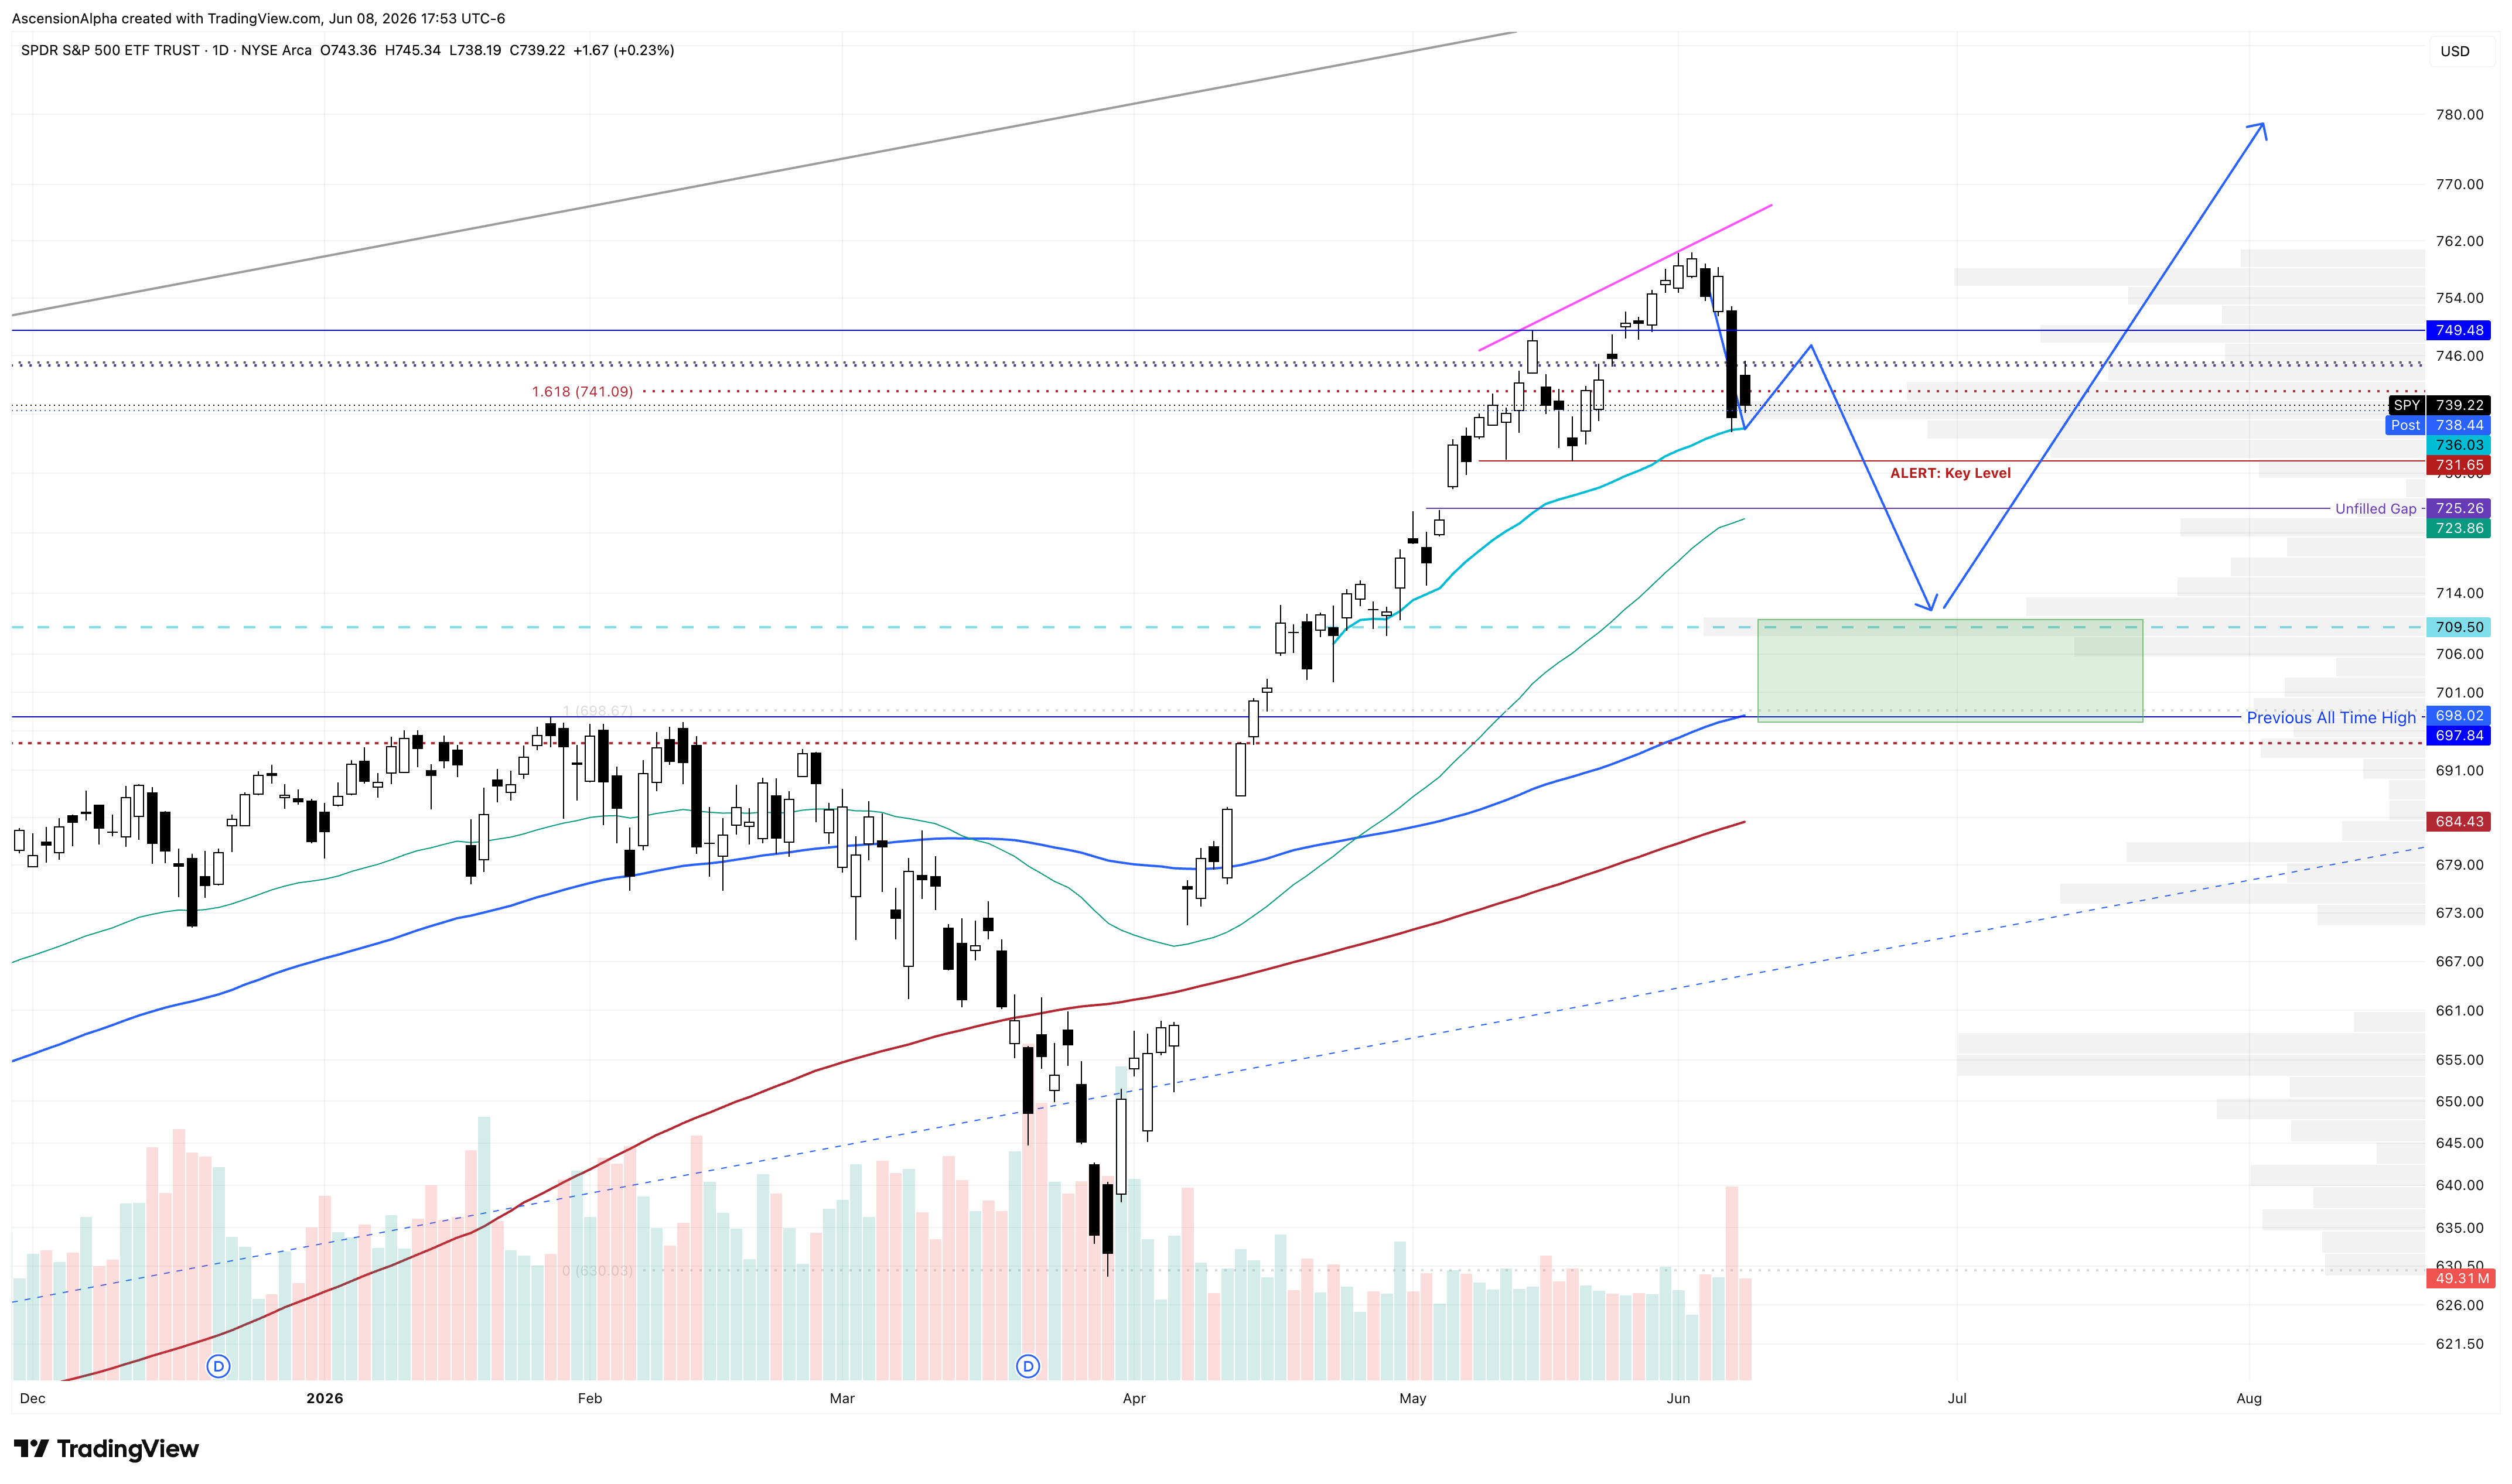
SPY gapped up right into the $744 resistance region I outlined in the last newsletter and then sold off, closing right back near Friday’s lows. I still think there is a chance we get one more push higher into the $749 level, but so far this is playing out in the head and shoulders scenario I have been watching for.
If SPY starts breaking below the anchored VWAP and Friday’s candle low, that will be the first sign that the larger retest is underway. A close below $731 should open the door for a quick move back into the gap-fill area around $725 and ultimately down toward $710. The $700 level remains the major support zone on this chart, and I would like to see that hold if price even gets down that far.
SPY Daily Chart
Patience Is the Edge Right Now
The market has been on easy mode for two months. It has gone straight up, and nearly every bull trade has worked. I think that likely changes during June. For that reason, I came into this month raising cash and becoming much more selective. My job is to mitigate risk and patiently wait for an edge to appear. Right now, I am not seeing much that I think is a great high probability set up outside of day trades.
Because of the strength of the rally over the last two months, we are clearly in a bull trend. However, Friday’s candle suggests the short-term move is likely bearish. Because of that, I would prefer to buy most names at lower prices as I expect some downside follow-through in the broader market.
As I have said many times before, most of the Trillion Dollar Titans look primed for lower prices, and those declines will likely create buying opportunities. I am stalking GOOGL and AMZN for position trades if they pull back enough. NVDA, AVGO, and MU are also likely to provide outstanding opportunities if they ever give us a meaningful retest.
For now, I am choosing patience. The first five months of the year were absolutely bonkers, and I do not want to give back hard-earned gains simply because I am unwilling to wait for prime setups to materialize.
GOOGL Daily Chart

Bitcoin: A Bit More
If we look at Bitcoin, which I will be discussing more frequently now that it is approaching levels where the risk-to-reward is becoming attractive again, it is getting a bounce from the 200-week SMA. I still think we see at least one more lower low into the mid-$50,000 region before a larger bounce can get underway.
That said, every decline during this bear market has unfolded in three-wave structures, and each RSI low has ultimately marked the low for that particular leg down. Perhaps this time is no different and the larger bounce is now underway. You all know how much I dislike the phrase “this time is different.”
In fact, that is one of the reasons I think the ultimate low of this Bitcoin bear market could occur closer to the $40,000 to $38,000 region. In every prior bear market, Bitcoin has retraced at least 78.6% of the preceding decline before putting in a major low. Applying that framework to the current cycle would place Bitcoin around $39,000.
What makes that level particularly interesting is that it would also bring price back below the IPO low of IBIT at $22.00. Much like many technology stocks that undercut their IPO lows before beginning a new advance, I think BTC may need to do the same thing before it finds a lasting bottom. That $38,000 zone would also place Bitcoin roughly 35% below the 200-week SMA, which is only about 5% lower than the average bear market overshoot we have seen in prior cycles. We also have the 100-month SMA sitting in that area, creating what would become a significant confluence zone if price reaches that level.
If Bitcoin reaches those levels, I will be a much more aggressive buyer for my long-term accounts and would once again have a significant percentage of my portfolio allocated to it.
That said, I think the risk-to-reward is becoming attractive even here, which is why I bought some on Friday and plan to add more in the mid-$50,000 region. Ideally, I would love to see one final capitulation event driven by terrible news that pushes Bitcoin down into the historical bottoming zone I outlined above, but since I cannot tell the future, I will start swing trading it here.
I want to see the point where everyone finally throws in the towel and turns bearish so that I can load up and once again become a mega bull on Bitcoin, which remains my favorite asset to trade.
BTC Daily Chart

I’m loving these newsletters. Thank you. They are helpful.