

QQQ held its key support, so the bullish triangle appears to be playing out as expected. SPY also broke back above its upper trendline and looks ready to continue higher as the market rotation continues.
QQQ Daily Chart

Many of the mega-cap tech names had impressive bounces on Thursday, breaking out of consolidation areas and pushing into target zones. Thursday’s candle now becomes a line in the sand for many charts. For QQQ, the key level remains $700, or Wednesday’s low. However, Thursday’s low can also serve as a useful risk management level and provide trade setups across many individual names.
Since I was traveling on Wednesday and Thursday, I didn’t make any trades besides exiting XOM for a solid gain. That said, Wednesday’s candle on NVDA was extremely strong. It reached the targets from my initial trade setup while also creating a very attractive double-bottom pattern. If the market is going to make another strong move higher, it will likely need NVDA to participate.
Thursday’s candle perfectly retested Wednesday’s long bullish candle and closed as a bearish inside hammer, keeping that bullish setup intact. I won’t lie, it stings a little that I was not trading on Thursday and didn’t get to buy at the $200 neckline, but trading is about living life, not the other way around. When you travel, rest, and spend time with family, sometimes you’re going to miss a 10-out-of-10 setup.
At this point, a break above Wednesday’s and Thursday’s highs would provide another solid entry if we get it. On the other hand, if NVDA continues to consolidate, I will view it as buyable on dips as long as it holds the $190 level and the 200-day SMA. If that support breaks, especially in the near term, the chart becomes much more concerning. It would have filled its overhead gap only to confirm a massive head-and-shoulders pattern.
Part of the reason I’ve assumed we push bullish on NVDA, as I’ve mentioned before, is that the bearish head-and-shoulders pattern almost looks too perfect. The market has a habit of frustrating the greatest number of participants, and obvious patterns often fail when everyone is leaning the same way.
NVDA Daily Chart

Several AI names were also sitting at major support levels early this week, including COHR, AVGO, NVDA, VRT, and DELL and most held nicely and are pushing higher. GOOGL still looks like it has room to push toward $380. AMZN continues to look bullish yet has a battling double top and inverted head and shoulders with almost the same neckline. It also seems like MSFT wants to reclaim its 200-week SMA and continue higher.
AMZN Daily Chart
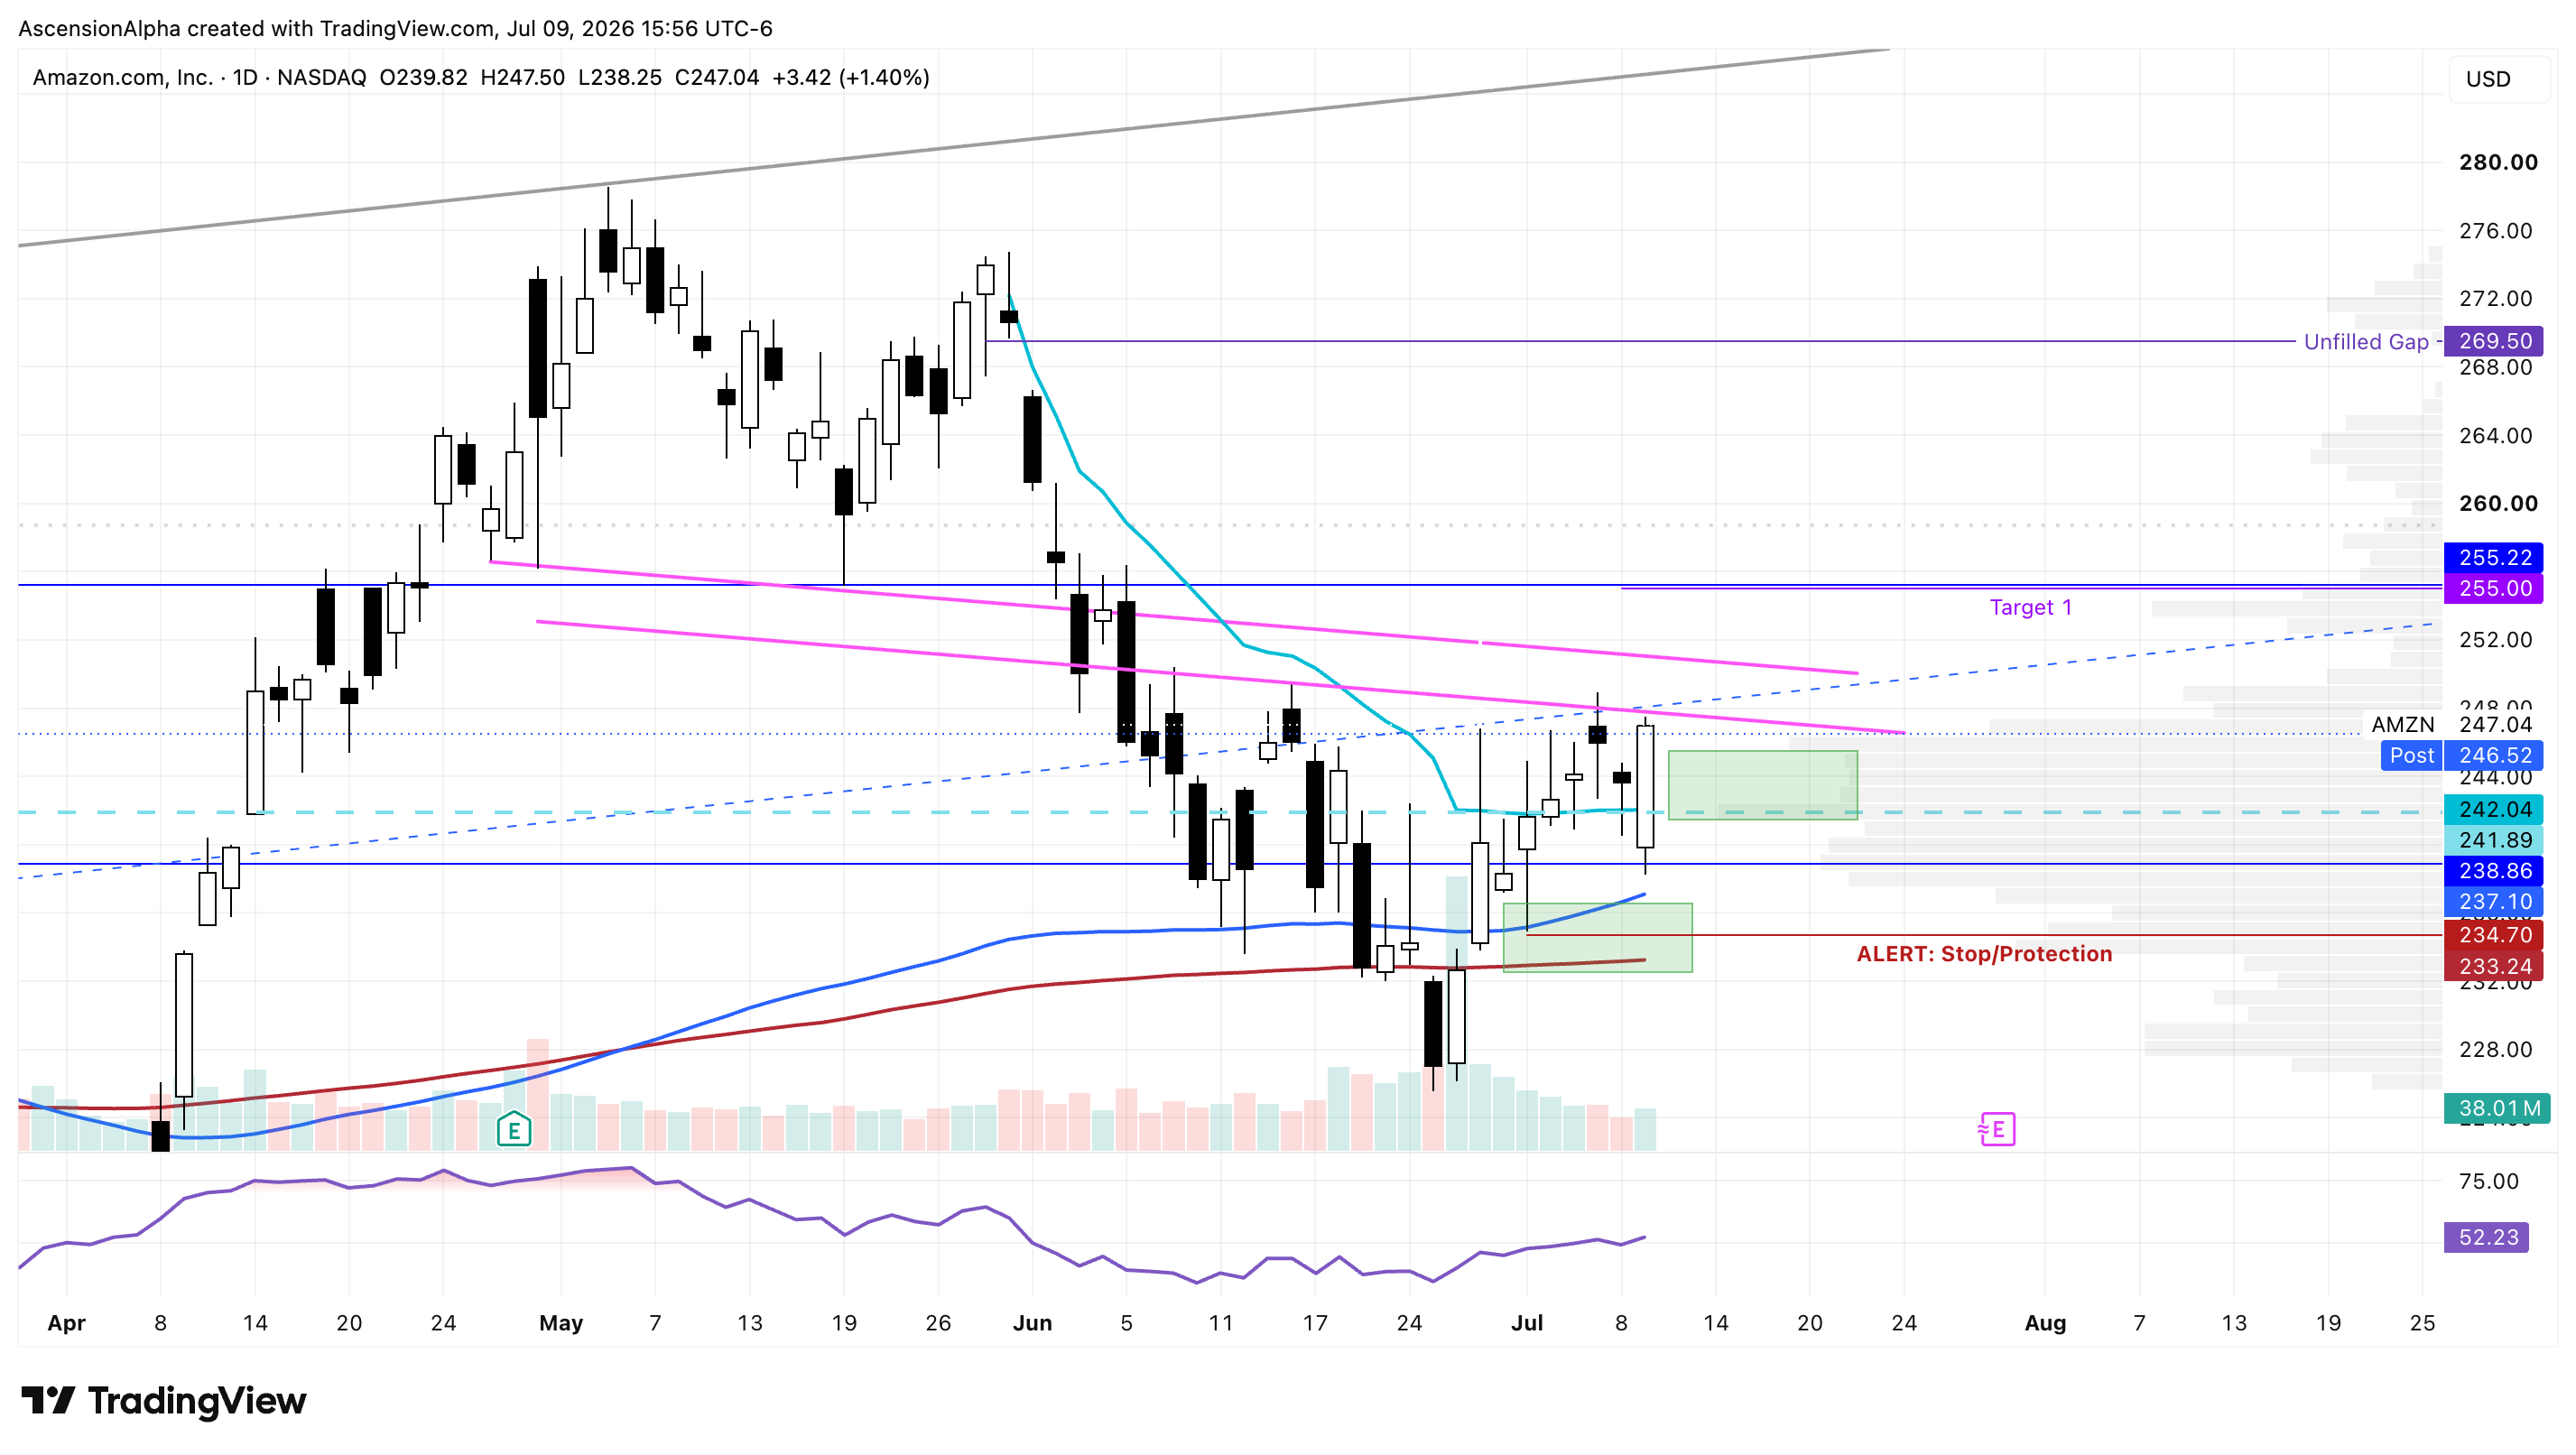
The AMZN chart pretty much sums up this market. It’s easy to make either a bullish or bearish case from many of these charts because there are legitimate technical patterns supporting both sides. That uncertainty, combined with the incredible rally we experienced this spring, is a big reason why we’ve transitioned into such a choppy, bifurcated market.
For now, it looks like we’re likely to remain in this rotational environment where leadership can change quickly. One key level breaking can either turn into a bear trap or confirm that a larger breakdown is underway. Right now, my read on the market remains bullish. As long as the price action from the past two sessions continues to hold across the major indices and leading stocks, I believe dips remain buyable.
That said, if those key support levels begin to fail, I’ll change that stance just as quickly. That’s one of the greatest advantages of being a trader. We don’t have to be right all the time. We simply have to recognize when we’re wrong and adapt. In fact, the better you become at being wrong quickly, the better trader you’ll ultimately become.