


Oil prices, tariffs, political shenanigans, war, money printing, inflation, and circular financing throughout the AI ecosystem are all influencing market decisions right now and contributing to a high level of uncertainty.
So far, the QQQ has been stuck in a choppy, sideways corrective market since June 4th, or roughly 89 days. The last major period of consolidation lasted 151 days before we finally found a low into March 2026.
QQQ Daily Chart

Historically, this type of chop on the QQQ tends to occur after periods of meaningful market appreciation. In 2025, the QQQ chopped for 151 days after gaining 58% in just 205 days. In 2023, the QQQ chopped and pulled back for 99 days after a 50% run in only 204 days.
This year started with one of the most bullish moves we have seen in decades, with the QQQ gaining 34% in just 65 days without so much as a meaningful dip along the way. A move like that needs time to be digested by the market, and that is exactly what we are seeing right now.
The names that created that massive move are still consolidating, and the market is still trying to determine whether those gains were justified and, more importantly, whether there is still meaningful upside left in the tank.
Bulls Can’t Hold Any Momentum
Following Warsh’s speech on Friday, selling pressure increased and drove the markets lower, particularly AI-related technology and semiconductors.
NVDA broke down below its earnings candle, which is not what you want to see if you are looking for immediate upside in the markets.
Interestingly enough, AAPL, GOOGL, MSFT, and AMZN showed strong relative strength on Friday and almost appeared to be treated as safe-haven plays within technology. The question is how long that can last.
With the amount of money GOOGL, MSFT, and AMZN are spending on AI infrastructure and capital expenditures, I am not sure the market will continue to view them as safe havens if we actually see a meaningful volatility event.
AMZN Daily Chart

AAPL is a little different. They continue to print enormous amounts of cash while keeping capital expenditures relatively controlled, which could make them a more defensive name if the market starts to experience a broader risk-off event.
$700 Is THE Level to Watch on QQQ
The key level to watch from here on the QQQ is $700. This is where the 100-day SMA and the gap fill from the August 4th gap both reside.
Since last Thursday’s gap up out of the AVWAP pinch we had been watching has now failed, it is likely that $700 will be tested.
Whenever you see a solid bullish setup fail, it is a reason to become a little more cautious. When you see multiple bullish setups fail in succession, that is something that needs to be factored into the trading plan.
That is exactly what we have seen throughout the second half of August. There is clearly some fear looming in the market right now, and the bulls have not been able to regain control.
The QQQ and SPY still have the more bearish setups available to them, including the possibility that we are entering a C wave lower that could take us to or below the July lows.
What I find particularly interesting is that SMH and SOXX are already showing this setup, and both have broken below their 100-day SMA. That lends additional credibility to the possibility that this bearish scenario could play out.
SOXX Daily Chart

The AI Trade Needs to Hold Up
Memory names like MU and SNDK have held up relatively well, but even they have versions of this same count that could begin playing out.
When you look at the entire AI stack as a whole, a large portion of the sector appears to be forming some variation of this pattern.
One of the best examples I found is MRVL.
Looking at the chart, we can see that MRVL moved vertically lower throughout June and July before forming a choppy, messy uptrend. Then, on Friday, the stock gapped down and began another potentially vertical move lower.
MRVL Daily Chart
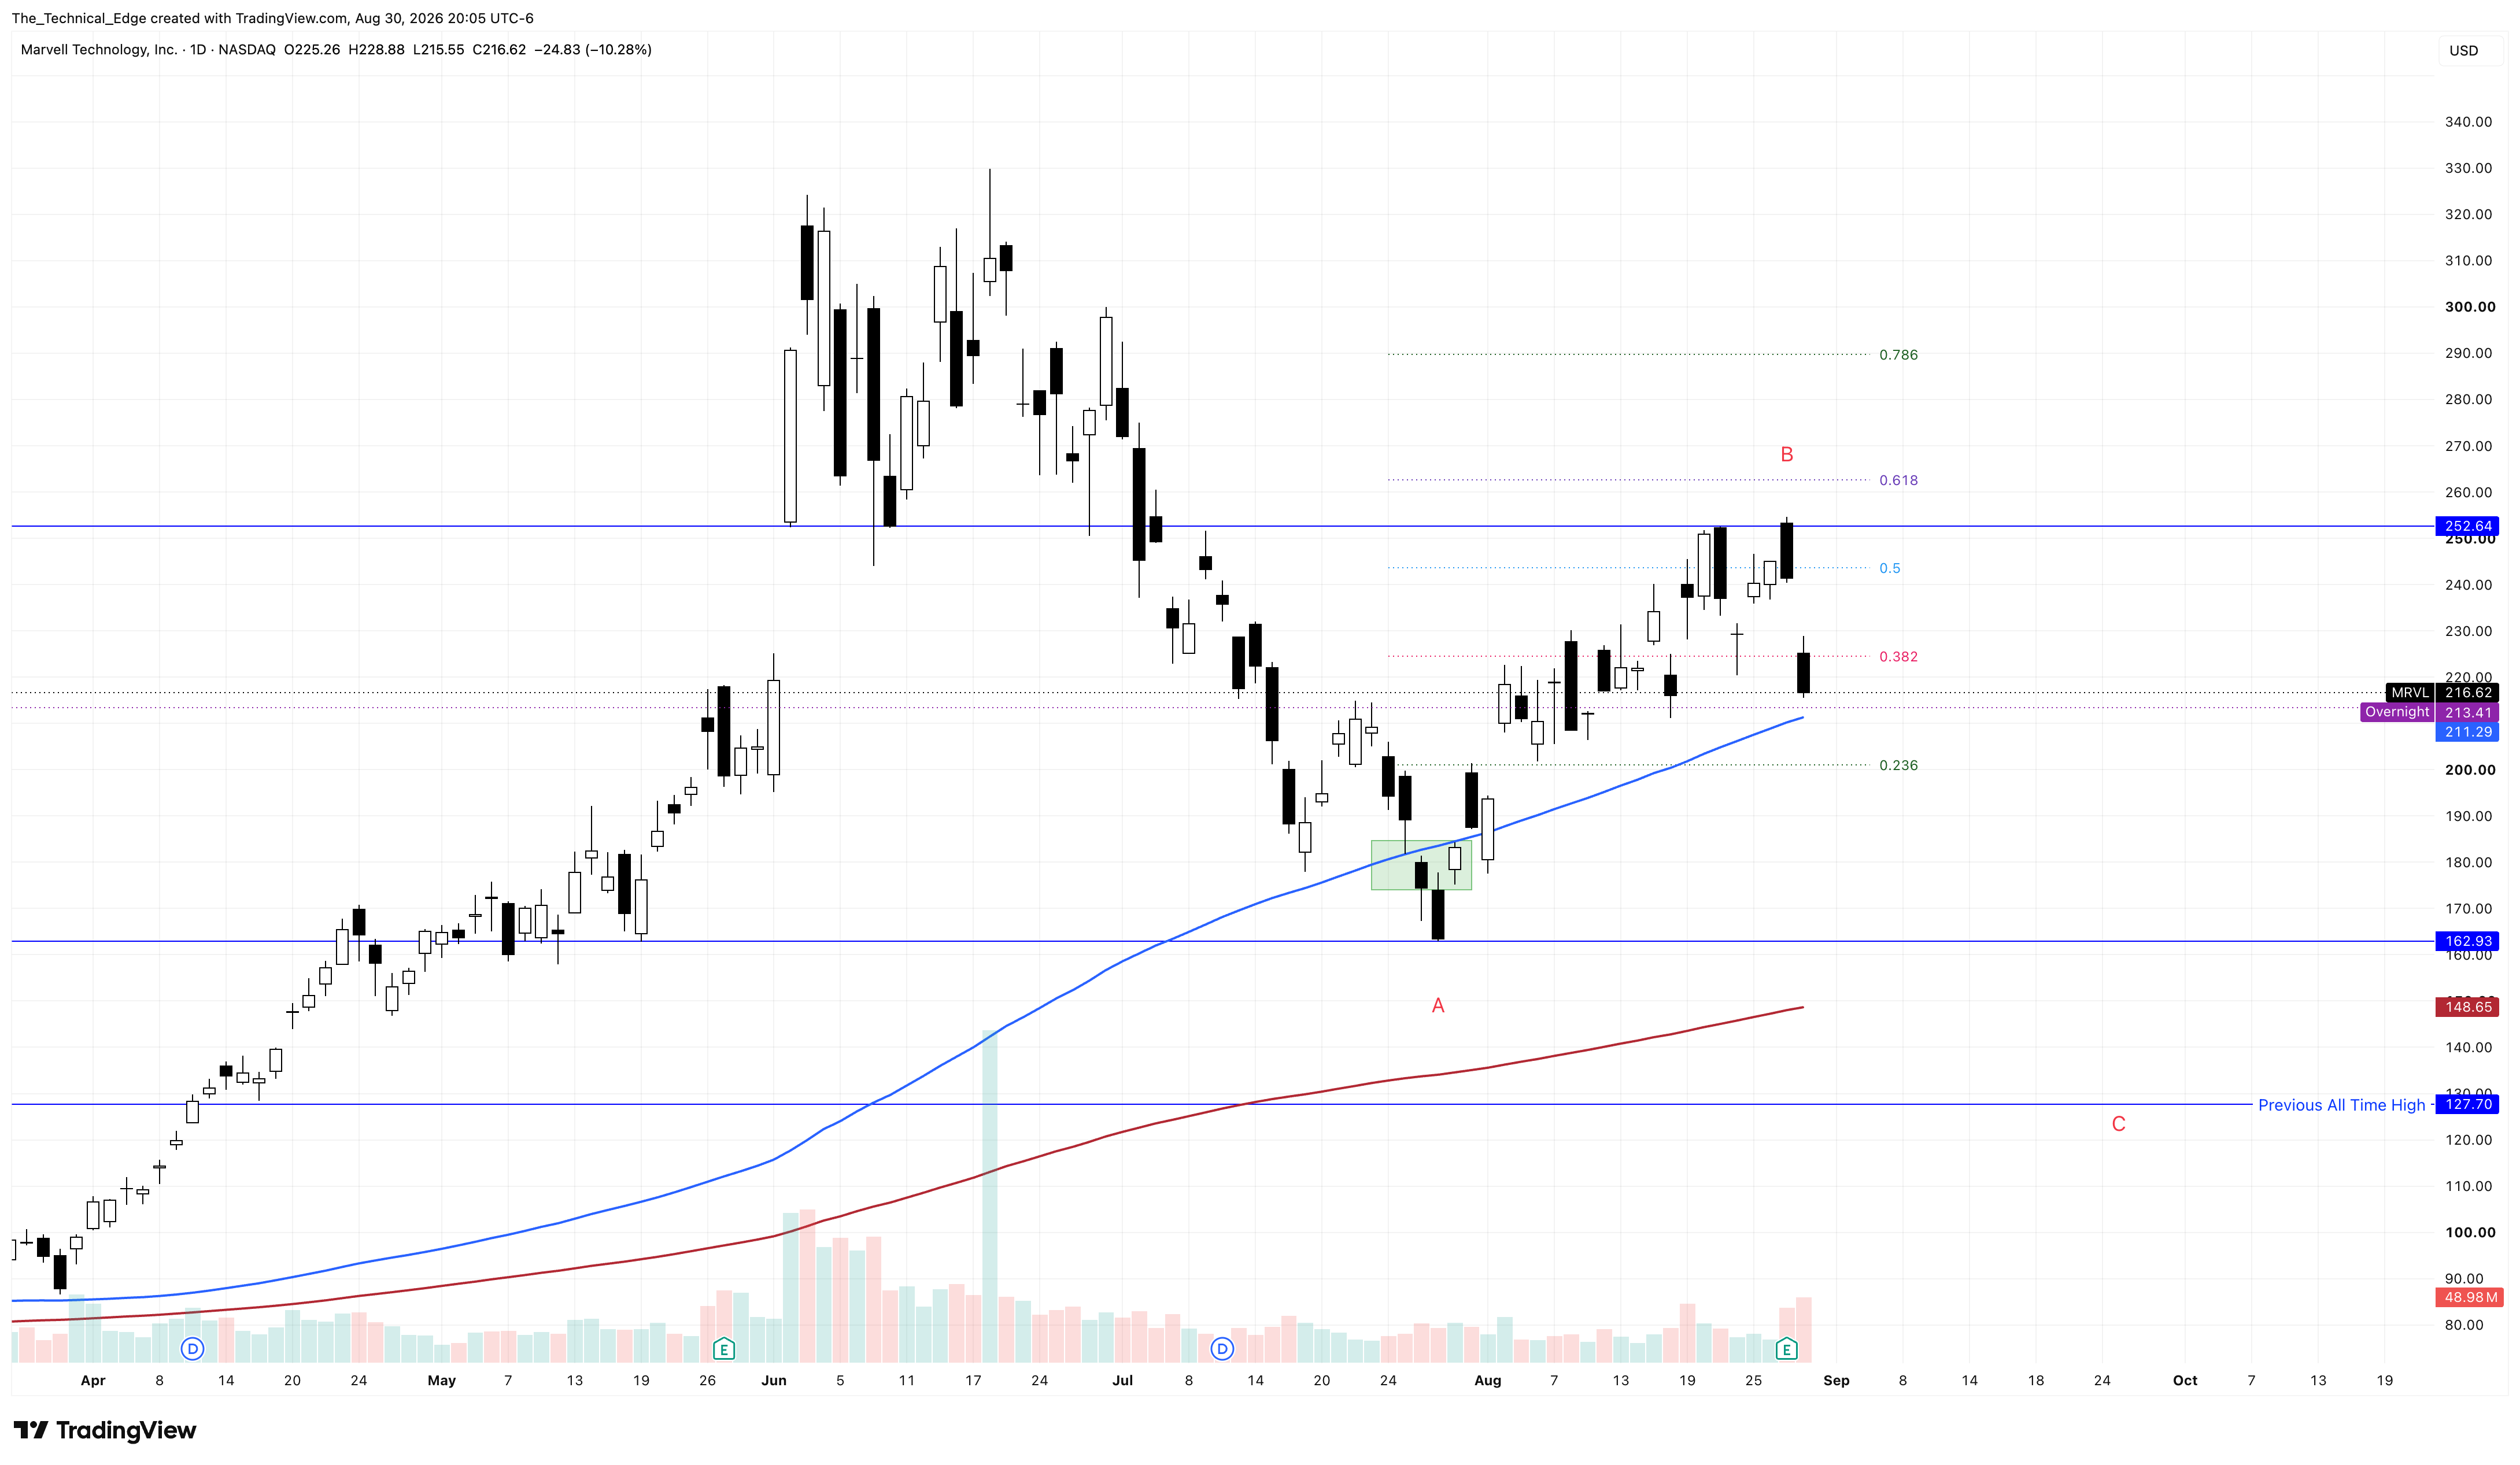
This is a pattern we are seeing across many areas of the AI trade.
The market needs big tech and AI to play ball if we are going to see a meaningful move higher into September and October. However, that scenario would go against historical seasonality, as September has traditionally been one of the weakest months for the QQQ, with the index finishing the month green only about 48% of the time.
The good news is that if we do sell off and create a larger ABC corrective pattern, it could ultimately set up the seasonal trend of finding a low into October and then having a strong November.
For now, I am watching AAPL, GOOGL, and AMZN closely to see whether Friday’s candles hold during this period of weakness. I am also watching the $700 level on the QQQ.
If those stocks begin breaking down and QQQ loses $700, I will shift toward being fully hedged and assume we are likely entering a much larger C wave lower.
The market remains in a choppy corrective environment. This has become an environment to do less, be more conservative, and protect the gains made earlier in the year.
Better trading conditions will come. During this period of chop, I will look to buy quality names lower rather than chase breakouts higher. For now, I am largely ignoring breakouts until they prove they can actually work and follow through.
The market does not owe us a trade, and there is no reason to force one in an environment like this. Sometimes the best trade is simply to wait. I think it makes sense to respect the risk, protect capital, and let the market prove to us which direction it wants to take next.