


The rotation I have been watching picked up on Friday, with the Dow Jones Industrial Average (DIA), XLF (financials), IGV (software), XLY (consumer discretionary), and XLU (utilities) all closing nicely higher.
IWM Daily Chart

Out of all the sectors I watch, only SOXX (semiconductors) and XLE (energy) closed in the red on Friday.
This rotation makes a lot of sense considering how oversold many of these sectors had become. RSP had seven consecutive down weeks and nearly retested its 200-week SMA and its prior all-time high from January. At the very least, a short-term bounce was a high-probability trade.
Earnings season kicks off this week with the financials reporting, which means XLF will be at the top of my watchlist. As long as it holds the 100-week SMA, which is now about 4.5% below current price, I see XLF as a buyable dip within a choppy uptrend.
XLF Daily Chart

Does AI Hold Up?
The main question at this point is whether SOXX and the AI trade can hold up and push higher from here. SOXX is sitting right on top of its 100-day SMA and a key support zone. As long as it holds $525, it remains in good shape for another push higher in the short term. However, a break below that level would open the door to a drop toward the 200-day SMA.
I honestly have no idea which way SOXX will go. Many semiconductor and AI names look like they could use one more leg down to complete their larger corrective patterns, but that doesn’t mean it will happen. If AI stocks have taught us anything, it’s that they can be incredibly resilient and keep pushing higher despite all expectations.
I know that if we get that final drop in these names, potentially creating double bottoms with the July lows, I’ll be looking to use that opportunity to add long exposure and deploy my remaining cash into the market.
However, if that drop never comes, SOXX is sitting at the 100-day SMA, a level where it has historically found support and bounced. In that scenario, adding some exposure with solid risk mitigation in place is the play in my opinion.
SOXX Daily Chart

AI and Semiconductor Names to Watch
GOOGL: If GOOGL can finally break above the 100-day SMA, I think it sets up for a solid trade toward the $375 brick wall that has held price down since May.
GOOGL Daily Chart

AMZN: Amazon just gave us a solid double bottom. As long as it holds the 100-day SMA, the play is to get and stay long. Remember, earnings for these names are coming at the end of October, so keep that on your radar.
NVDA: If we get a continued dip in NVDA, I think it’s a solid buy around $221 and $214. Below the 100-day SMA, things get a little dicey as we try to determine which pattern is playing out. However, $214 is a major support level. If NVDA drops that far, I suspect we would also be seeing that next leg lower in SOXX.
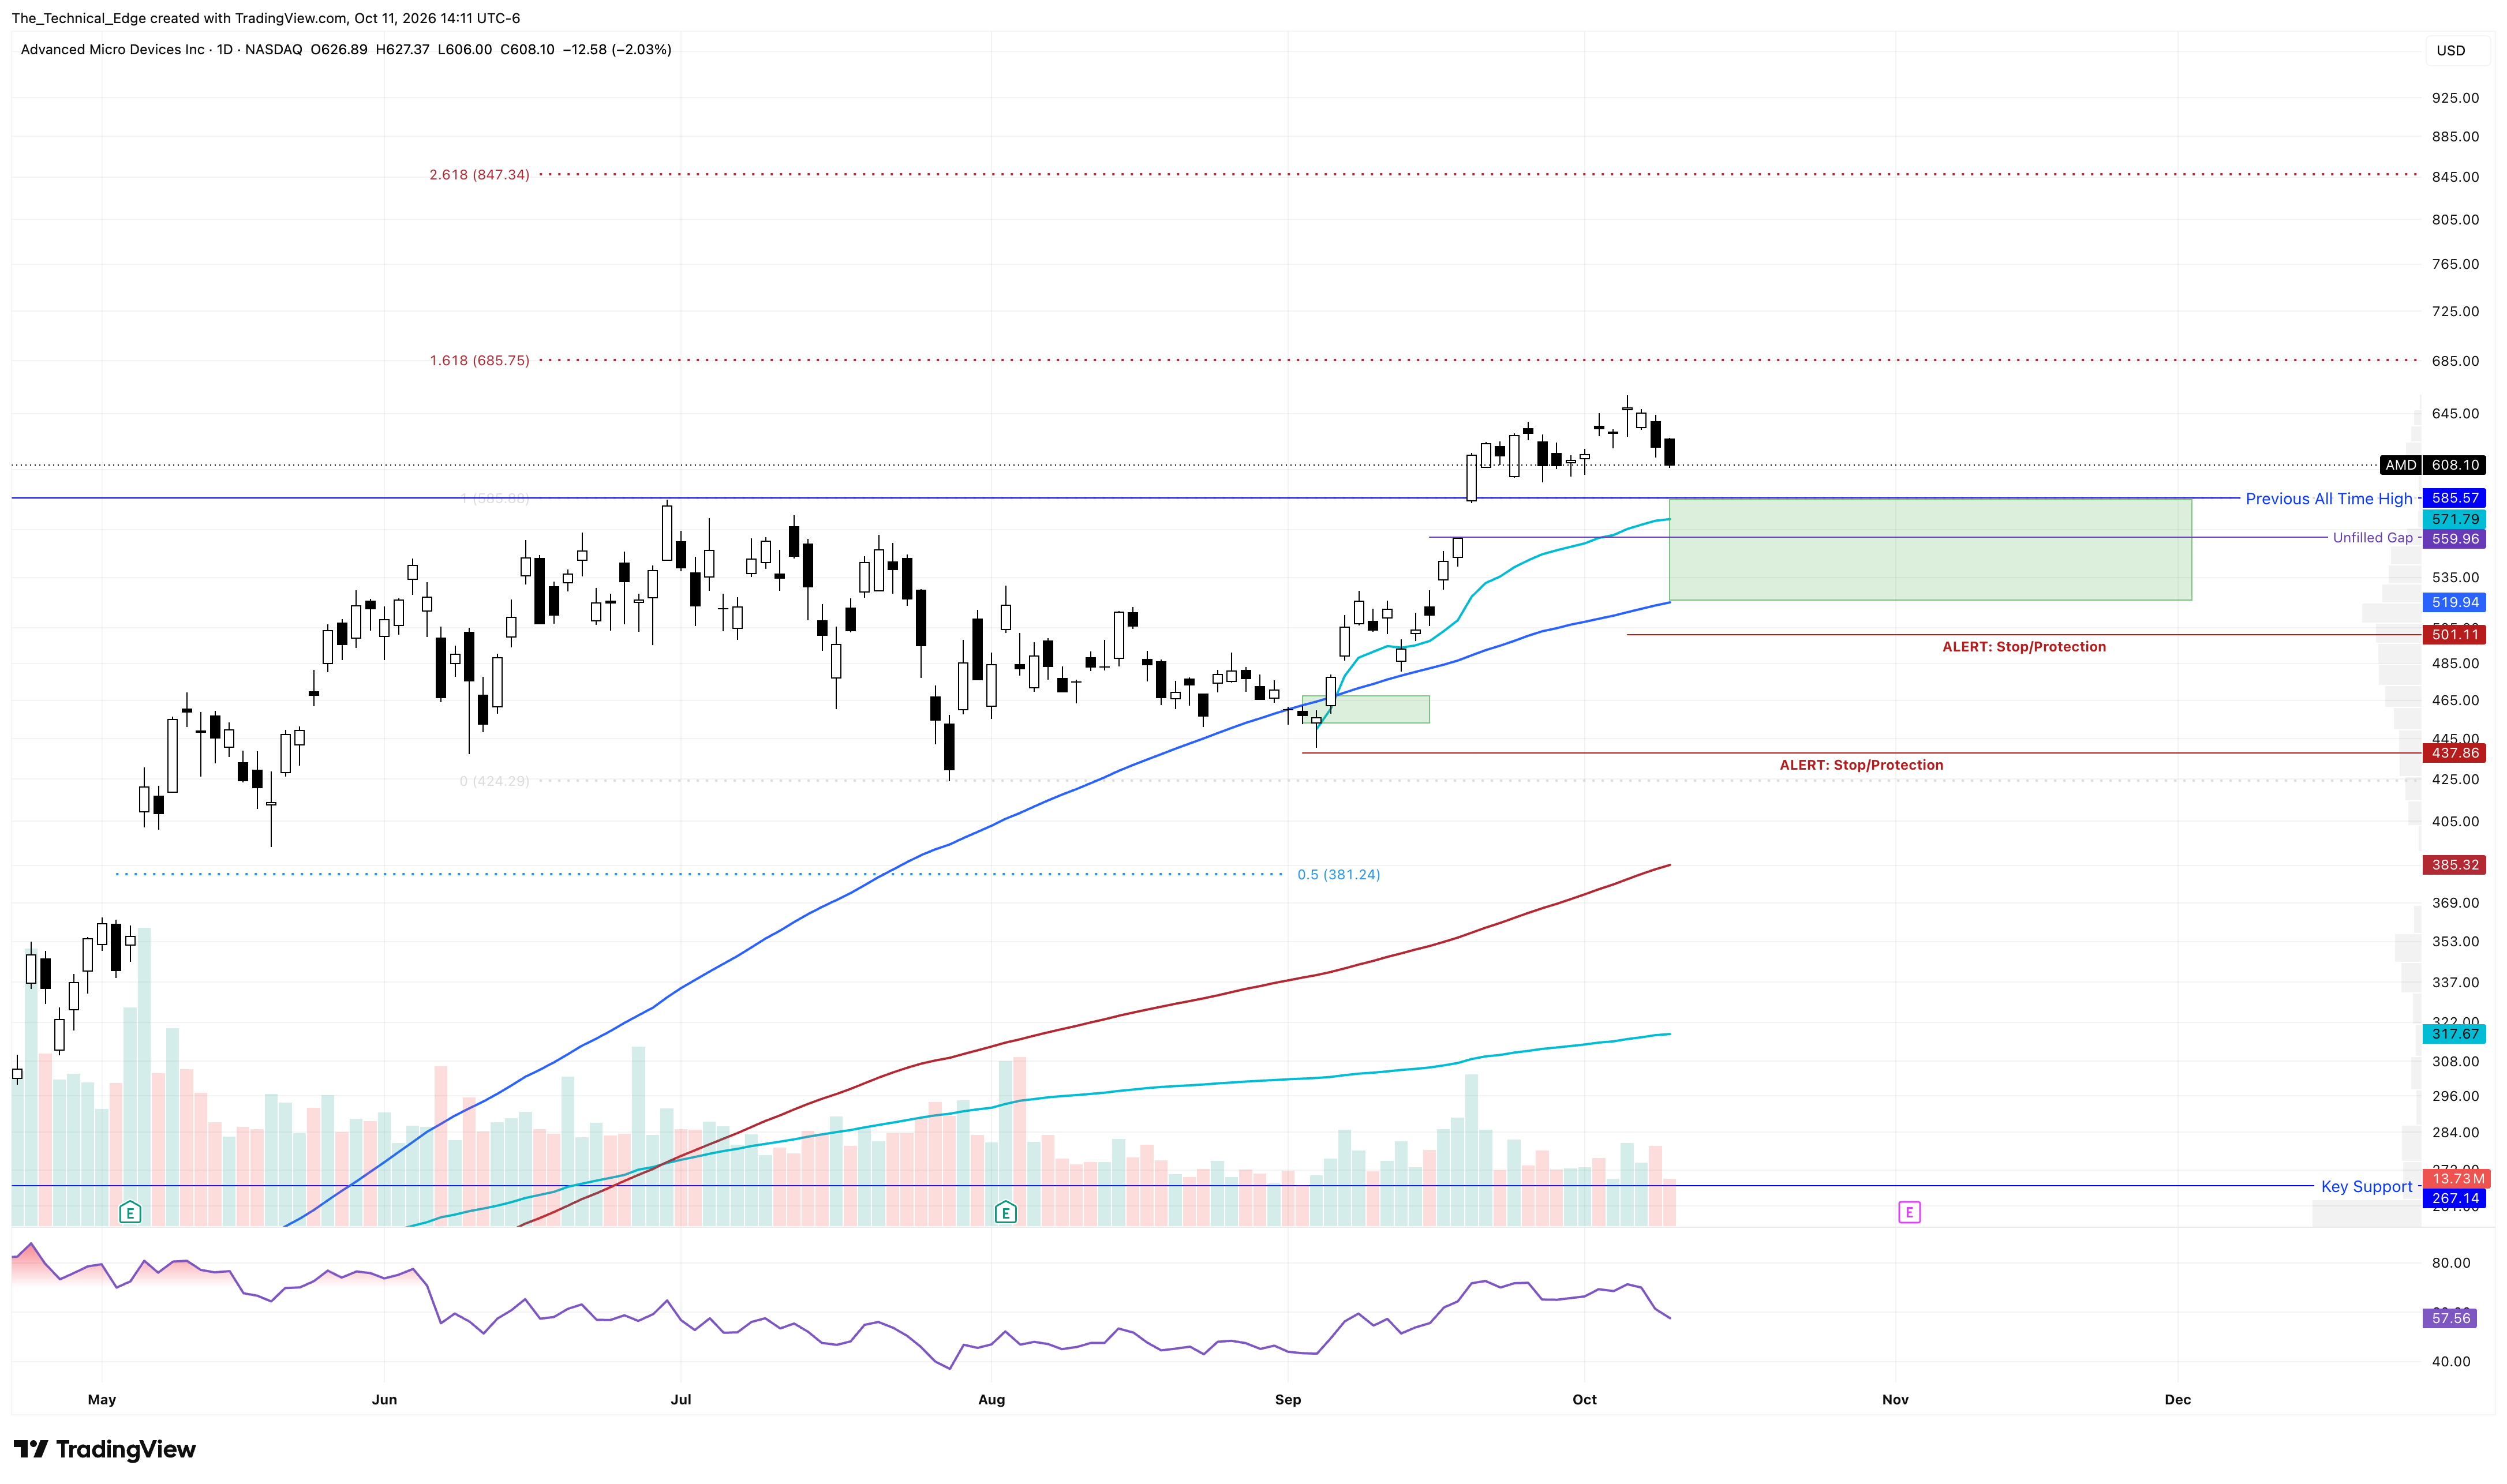
AMD: AMD may be starting to cool off a bit. It has a gap fill around $560, which I expect to get filled. That puts the potential buy zone between the prior all-time high around $585 and the 100-day SMA at $519. That’s a wide zone, so how aggressively you approach this trade will depend on your trading style and time frame. As long as AMD holds the 100-day SMA, it still looks good for a push toward $685, the 1.618 expansion of the recent drop.
AMD Daily Chart
INTC: Intel just broke below its 100-day SMA, so risk is elevated here. However, it still has a pattern in which price pushes higher and makes new highs. Buy zones and stop placement are a little trickier in the short term. The best-case scenario, though not necessarily the highest-probability outcome, would be a drop toward the 200-day SMA and the gap fill below. That could present a very solid longer-term buying opportunity.
Stay Patient
There are lots of great plays in the market right now. It hasn’t been the easiest market to trade lately, but there are still good opportunities if you know where to look and have the patience to let charts and trades play out.
COST was a brilliant trade featured here just a few days ago, and it has now hit its target and played out beautifully.
In a rotational market, I like to look beyond relative strength. I’m also watching for bottoming signals in oversold stocks and sectors. Right now, AI names look like they should be setting up for a bounce, but if that doesn’t happen, we may get the volatile October after all.
Watch the key levels, respect the moving averages, and pay attention to earnings this week. Let’s see which sectors can keep building on Friday’s strength and whether the AI trade can find its footing.