Monday brought some more weakness into the markets. QQQ closed with what amounts to an inside candle, while SPY sold off a bit and closed back below last Thursday’s bullish candle, the one that looked like it might be the start of the next leg higher. Looks like we’re going to have to wait a little longer for that breakout.
The good news: I still think the highest-probability outcome here is a slight pullback that holds the key support levels below. There’s a small chance the recent run in QQQ and SPY was just a B wave, and that we’ve still got a C wave lower coming that takes out the old low. However, until we actually break support and start seeing a vertical five-wave drop, I’m treating that as a low-probability scenario, not the base case.
SPY Daily Chart

Worst case, in my mind, is we drop back toward the prior all-time highs and then find our footing heading into the September and October. I’m not married to that narrative at all. If price action tells me something different, I’ll change my mind.
And honestly, I call that the “worst case,” but for a lot of traders it might actually be the best case. Instead of the lockout rally we got in April and May, we might get actual retests this time around. That’s good news if you’re not as allocated as you’d like to be, since a dip into September could be exactly the entry you’ve been waiting for.
QQQ Daily Chart

Semis Still Showing Strength
Semis and the AI trade continue to hold up well. My account was up decently on the day, and at one point intraday it was up quite a bit more than that.
That’s part of the problem, honestly. The bulls keep struggling to hold onto gains. We keep watching selling erase much of the day’s progress by the close. The strongest names are still performing, but anything short of the best few stocks are having a hard time holding their momentum.
SOXX Daily Chart

Bond Yields, A Looming Concern
A big thing weighing on this market right now is long-dated yields. On Monday the 30-year hit 5.31%, its highest level in 20 years.
That’s not a rate the stock market can just ignore forever. If yields keep ripping higher, they’re going to pressure equities as the risk-free rate climbs. Future earnings get discounted harder, bonds start pulling capital away from stocks, borrowing gets more expensive for companies and consumers alike, and high-growth names in particular start feeling it most. Financial conditions tighten across the board.
The market can handle higher yields. We’ve seen that already, with yields and stocks both climbing since the March low. But if the 30-year keeps ripping like this, stocks will eventually have to take notice.
30 Year Bond Yields

Bitcoin Still Has Work to Do
This is kind of the moment Bitcoin was built for. It was supposed to be the escape hatch from an inflationary, money-printing fiat system. And yet the chart still looks pretty weak.
Bitcoin’s trying to reclaim the 200-day SMA, but it’s got a lot more work to do before I’d call this a real bottom. It would also be bucking a lot of its own history if this turns out to be the final low. Historically Bitcoin has fallen roughly 30% below the 200-day before major bottoms actually are formed. From where we sit today, that would mean Bitcoin would eventually see at the $45,000 level.
Anyway, for now at least, Bitcoin still trades like a risk asset, not the risk-off hedge against inflation and money printing it was supposed to be.
The use case gets talked about out every cycle. It’s been “its big moment” since 2020, and we’ve had several boom-and-bust cycles along the way. Until that actually changes, I’m letting the technicals call the shots.
BTC Daily Chart

INTC Setup
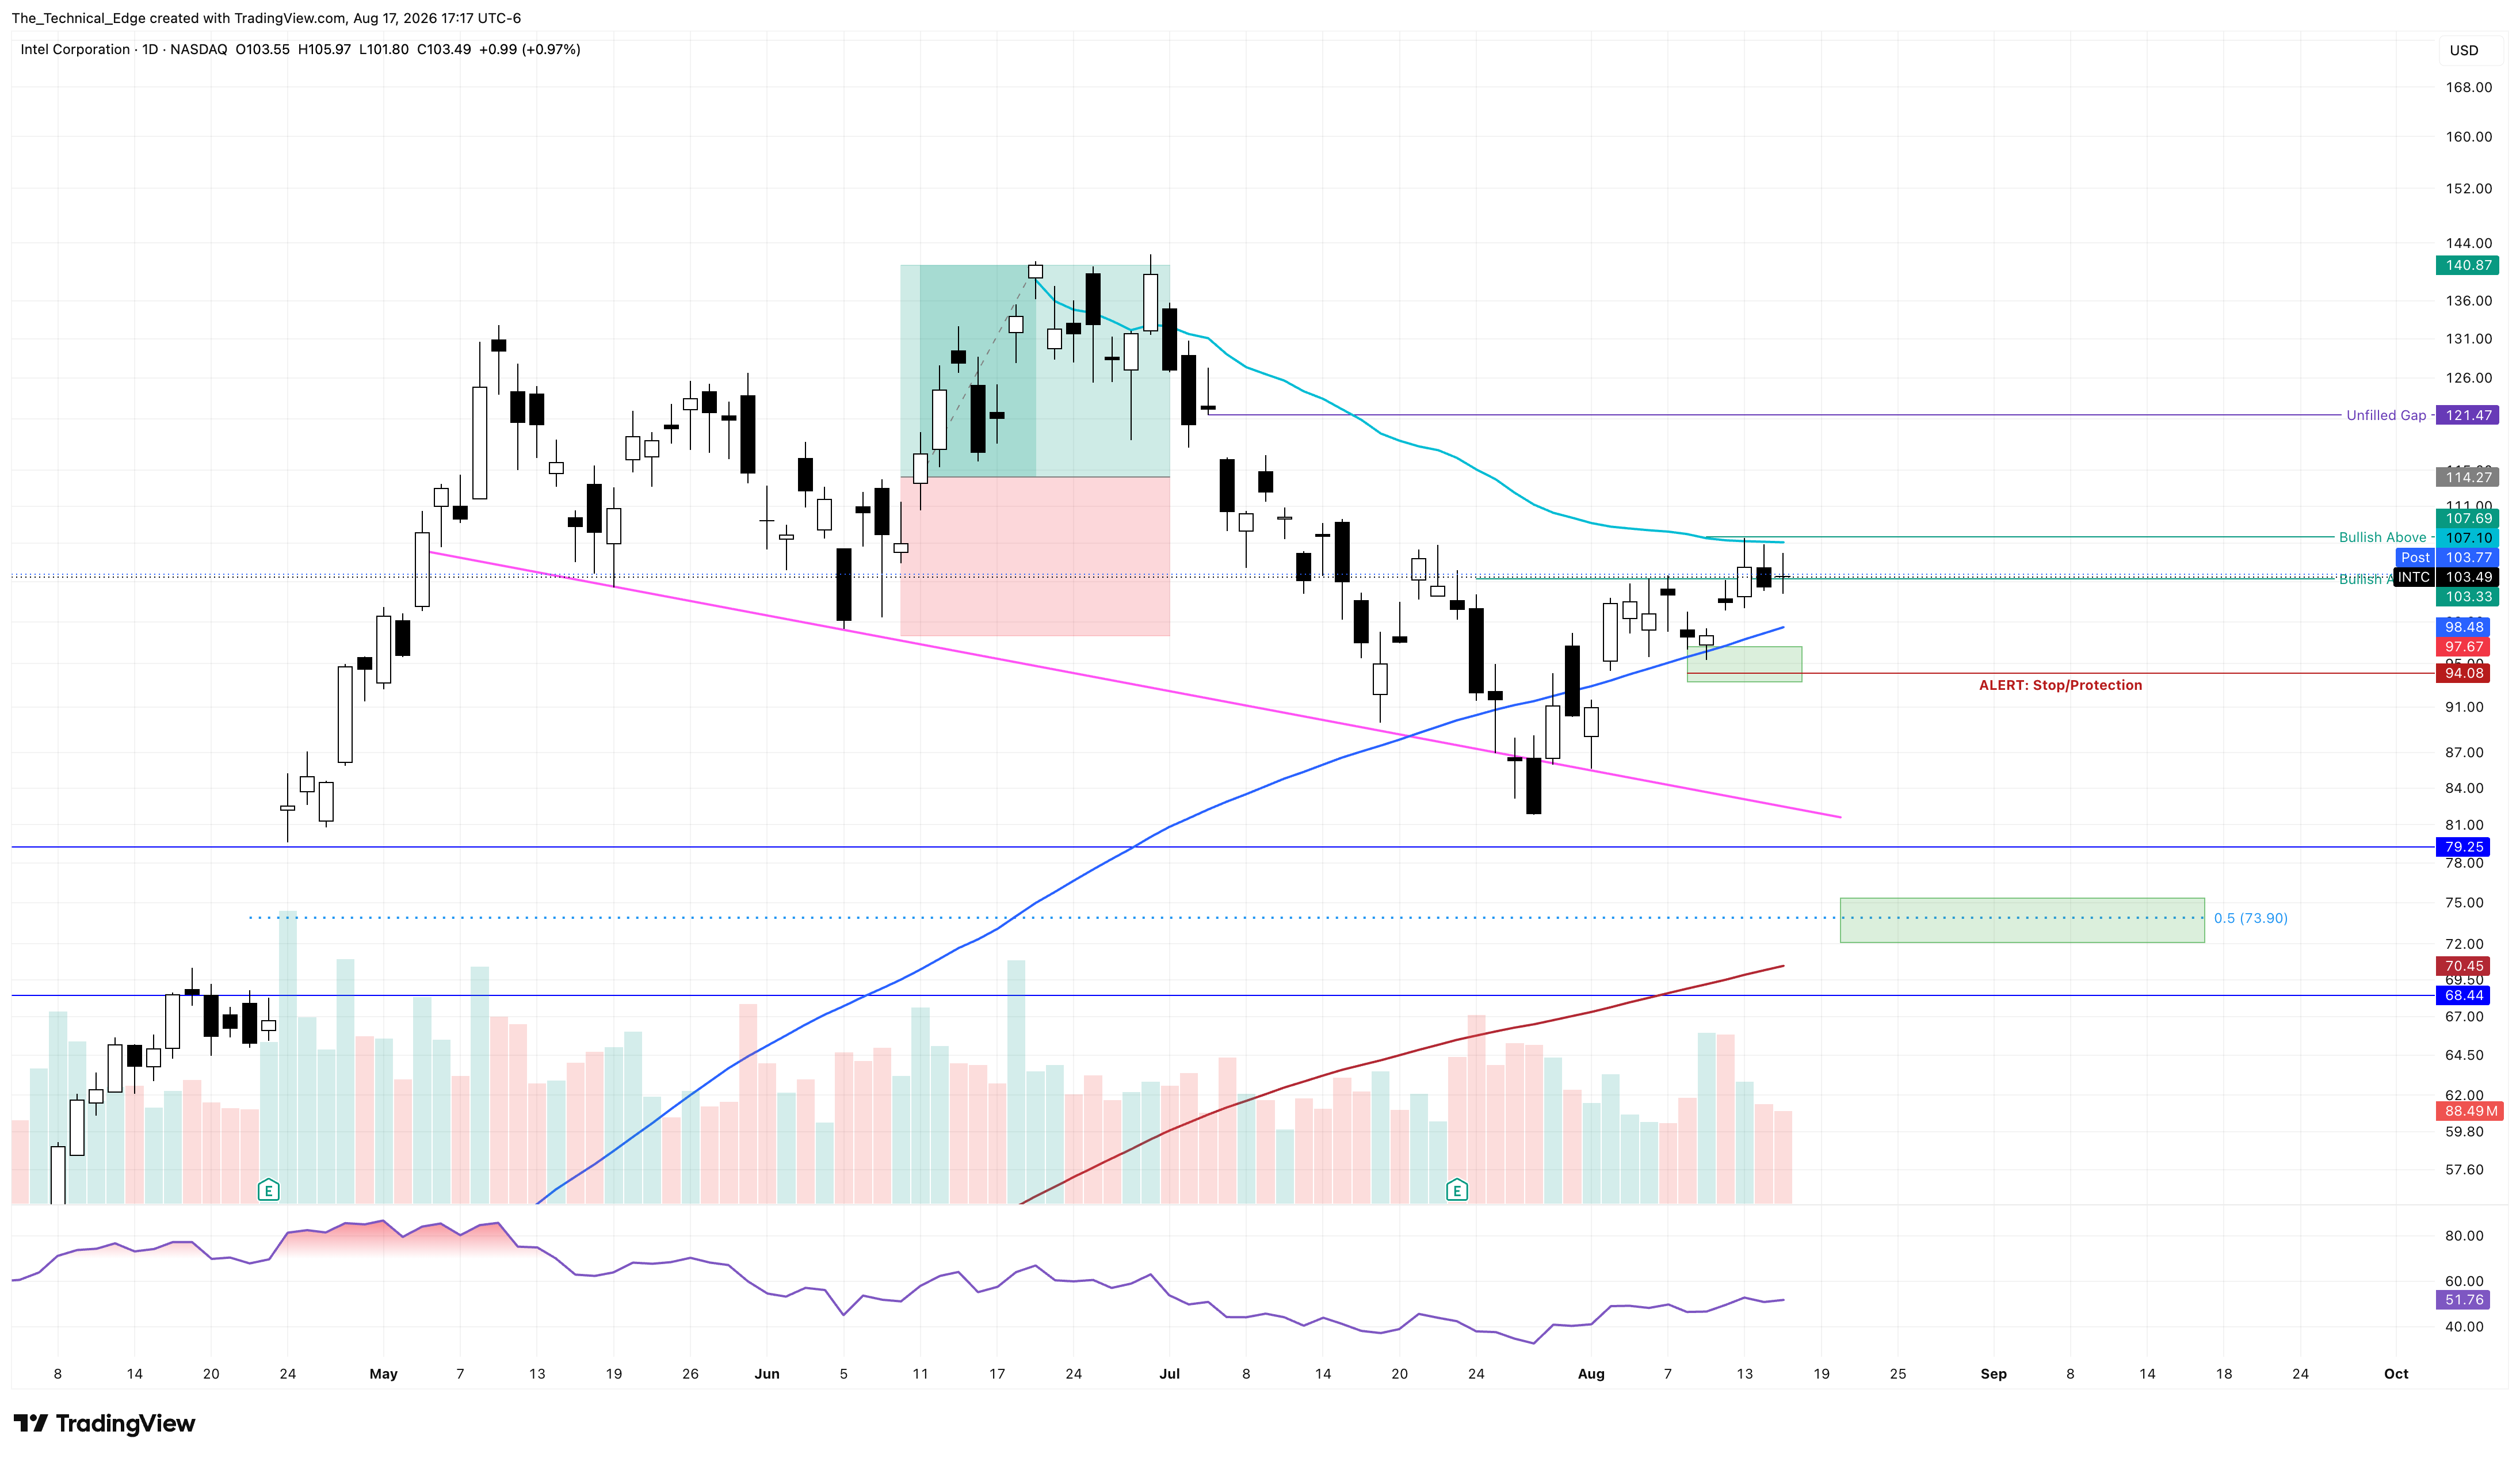
One name I’m still watching closely is INTC. Intel is consolidating after getting rejected off the AVWAP from the all time high. It needs to close back above that AVWAP, sitting around $107.10 right now, and if it can, I think the overhead gap fill is easily in play.
I don’t want to see is a close below the 100-day SMA, which keeps creeping higher, allowing for tighter risk mitigation each day. If it closes below the 100-day and can’t reclaim it the next day, the bullish thesis is off the table for now, and I’d start looking for a drop back into the $79 to $70 range. I am currently long and looking to add if we can break out above $107.00. I will trail out under the 100-day SMA.
INTC Daily Chart