Fear is once again creeping back into the market. Technical setups keep setting up and then falling apart. Strong breakouts and breakdowns aren’t lasting, they’re reversing in moments with little to no follow through. The Mag 7 is heavy and unable to run as a group, with the market growing wary of the hyper spending and free cash flow tipping negative across the group.
Swing trading has been difficult lately, no doubt about it. That said, with the macro backdrop we have right now, and SPY and QQQ still holding up quite well, it’s hard to get overly bearish, yet. That’s especially true because this is a range bound market for now, which means after four days of selling and the S&P dropping into support, we’re likely due at least some relief rally.
SPY Daily Chart
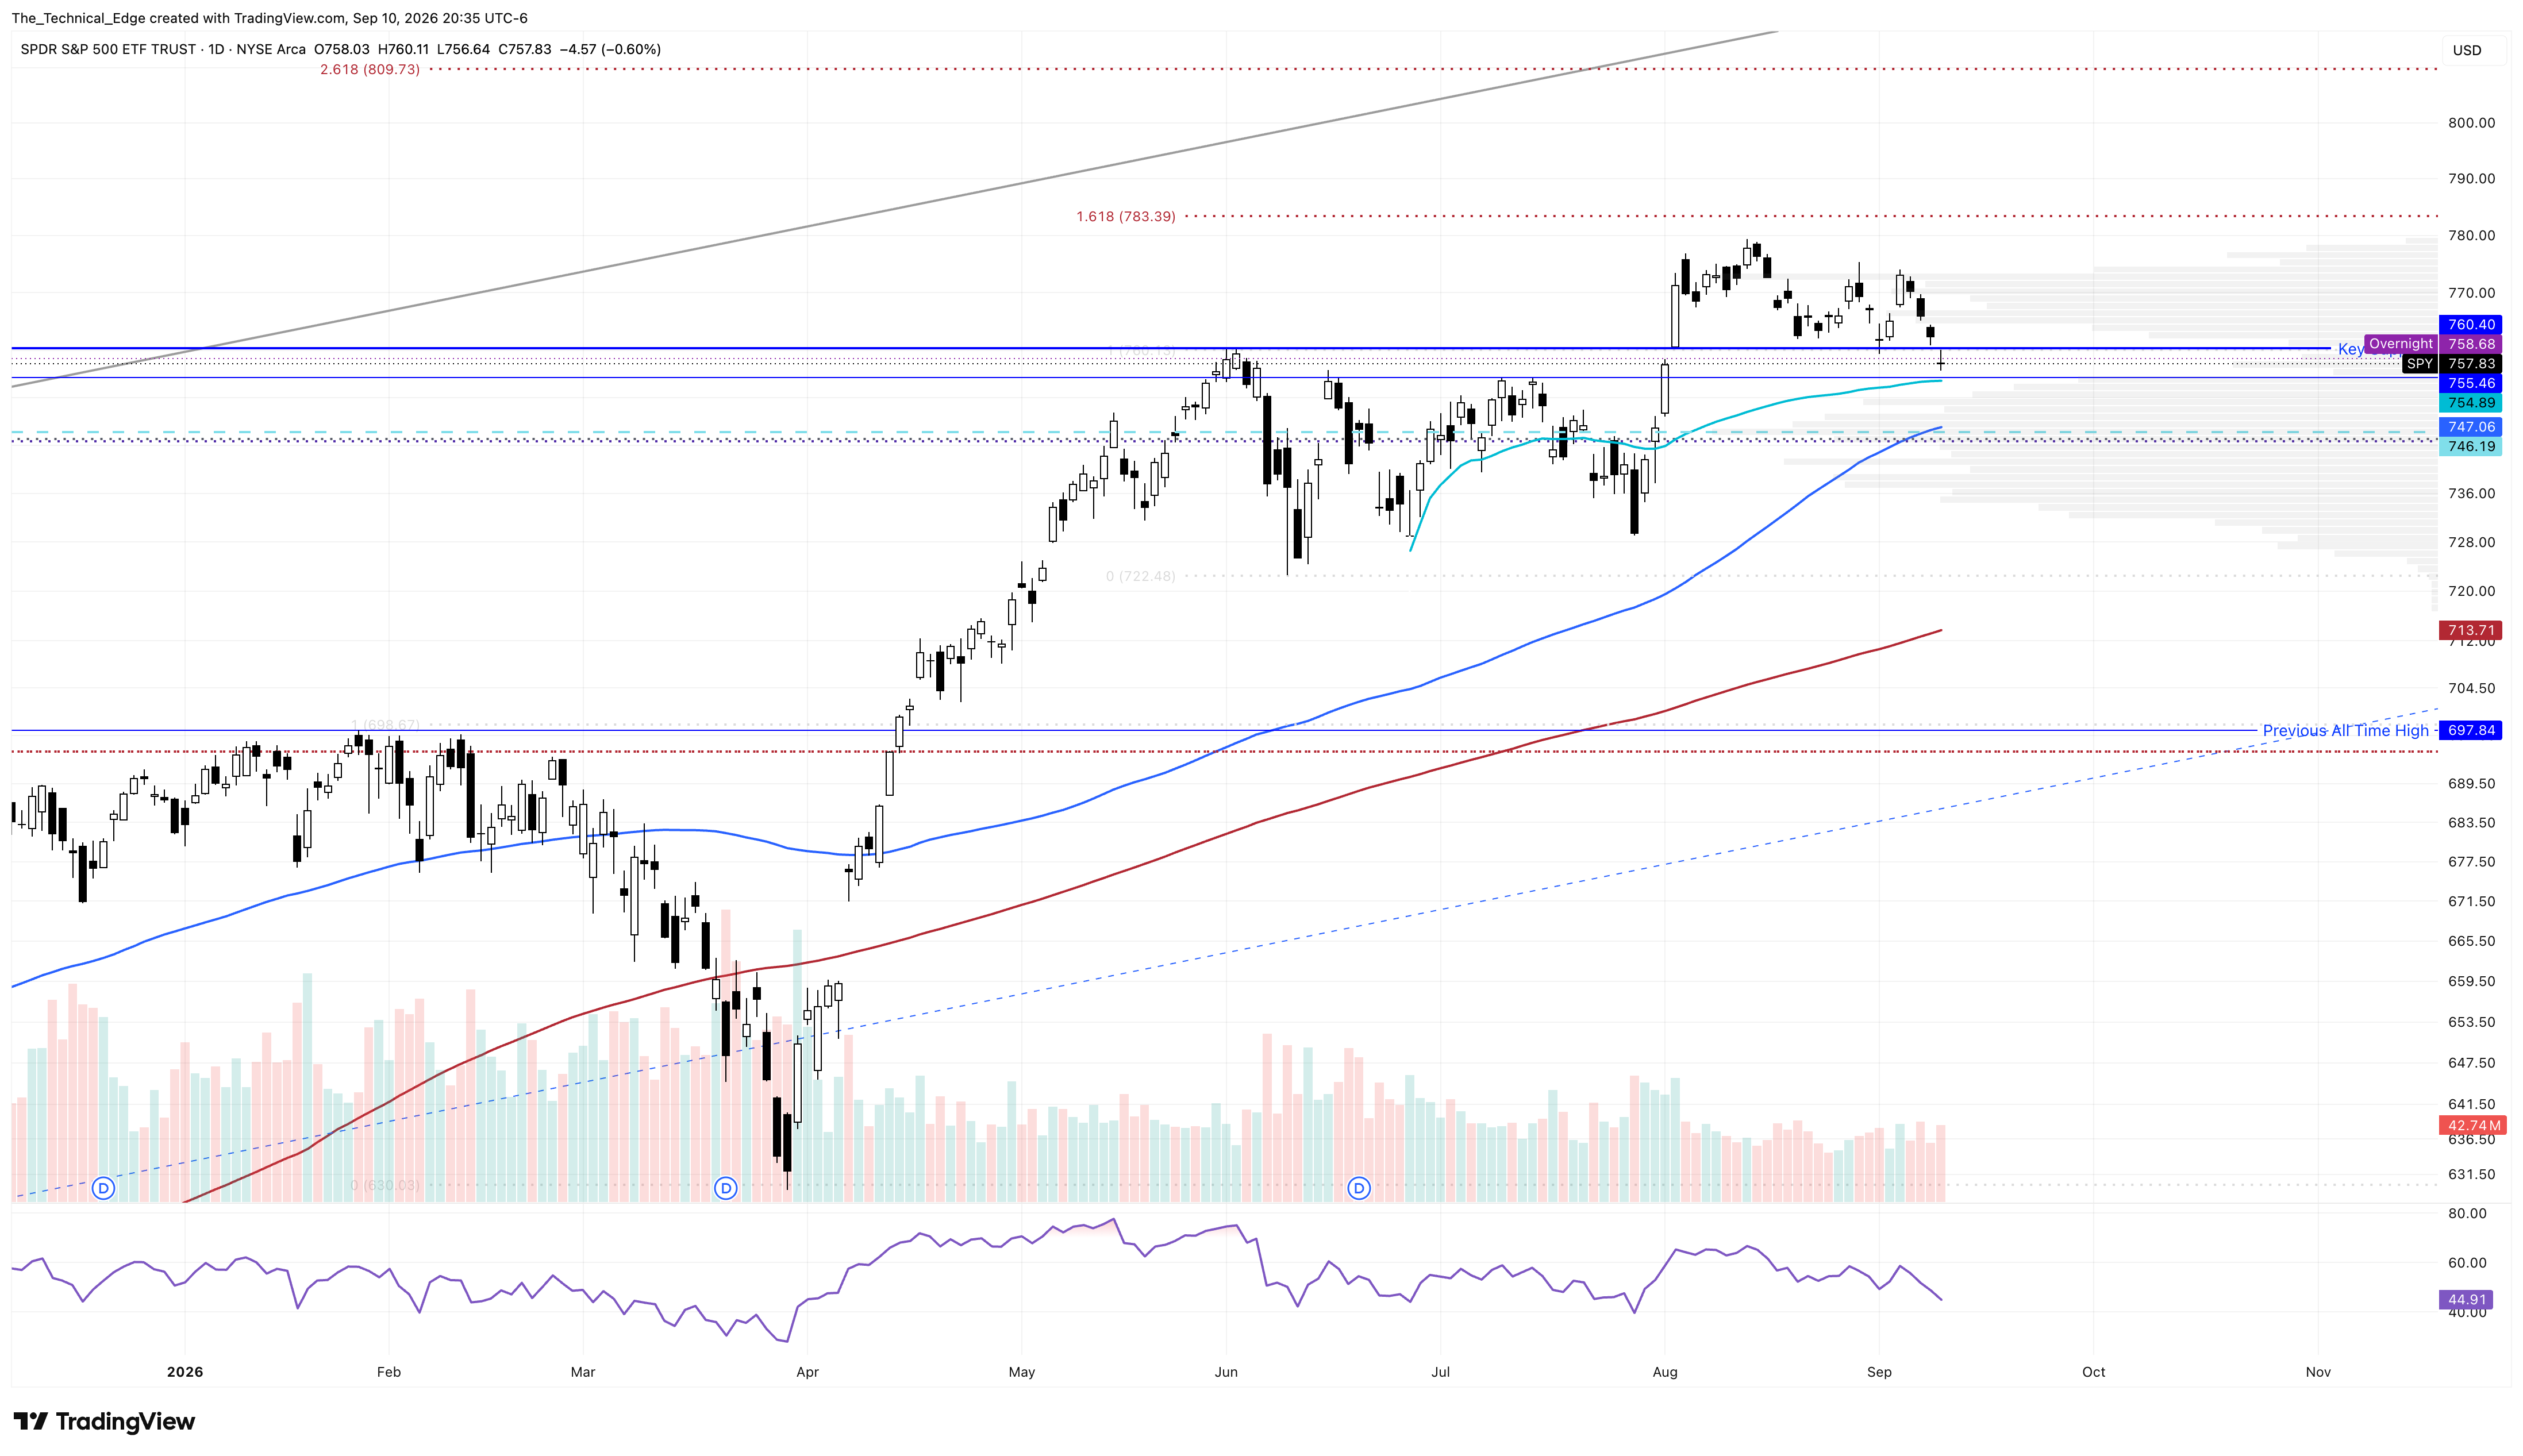
If just a few of these looming macro issues (oil, inflation, bonds, the Iran conflict) get cleared up, this market can get moving higher again. But until then, I see continued sideways chop, making this a buy low, sell high, and sell, high buy low market.
Oil Surges
Oil really needs to chill out. Ever since it broke above the 100-day SMA and its downward trendline on September 1st, it’s been ripping higher in a near vertical fashion. I warned that a break above that level would be negative for equities, but we haven’t really seen broad based fear enter the market. SPY, QQQ, DIA and RSP are all still above their 100-day SMAs. Only IWM has lost the 100-day SMA, and QQQ is now threatening a break of its own.
If oil keeps going vertical, don’t expect your equity portfolio to be ripping higher alongside it. Oil ripping higher drives inflation higher, which drives yields higher and bonds lower.
Crude Daily Chart

Right now the market is pricing in roughly a 70% chance the Fed raises rates next week, with the 2-year also signaling a hike is likely. That’s actually not the worst outcome as I think much of it is getting priced in already. If it happens, bonds might settle down a bit, and I think equities can absorb that small hit. If we don’t get the hike, which at this point would be the surprise, I could see equities push higher on that surprise. The one caveat is if bonds react badly to a non hike, that could spook the broader market. But bonds reacting badly is likely to just bring more intervention from the Fed anyway.
Simplifying in the Chop
I’ve been saying this for a while now, but with a market this choppy, I’m zooming out and taking a simpler approach. I’m still taking small swing trades because I can’t help myself, and those have worked with varying degrees of success, essentially breaking even on the lot of them over the past six weeks. Honestly, breaking even on swings in this market is a win in my book. With how many banger setups have failed to play out, it would be easy to get discouraged, but if you’re protecting your downside and staying nimble, you’re winning, and you’ll be ready to capitalize once this market starts moving again in either direction.
I’m using the 100-day or 200-day SMA as a hedge level on everything I’m in right now. QQQ closed essentially right on its 100-day SMA. It also has solid support at $701, which is the key level I’m watching right now. As long as QQQ holds that level, I won’t get too bearish.
QQQ Daily Chart

Seasonality
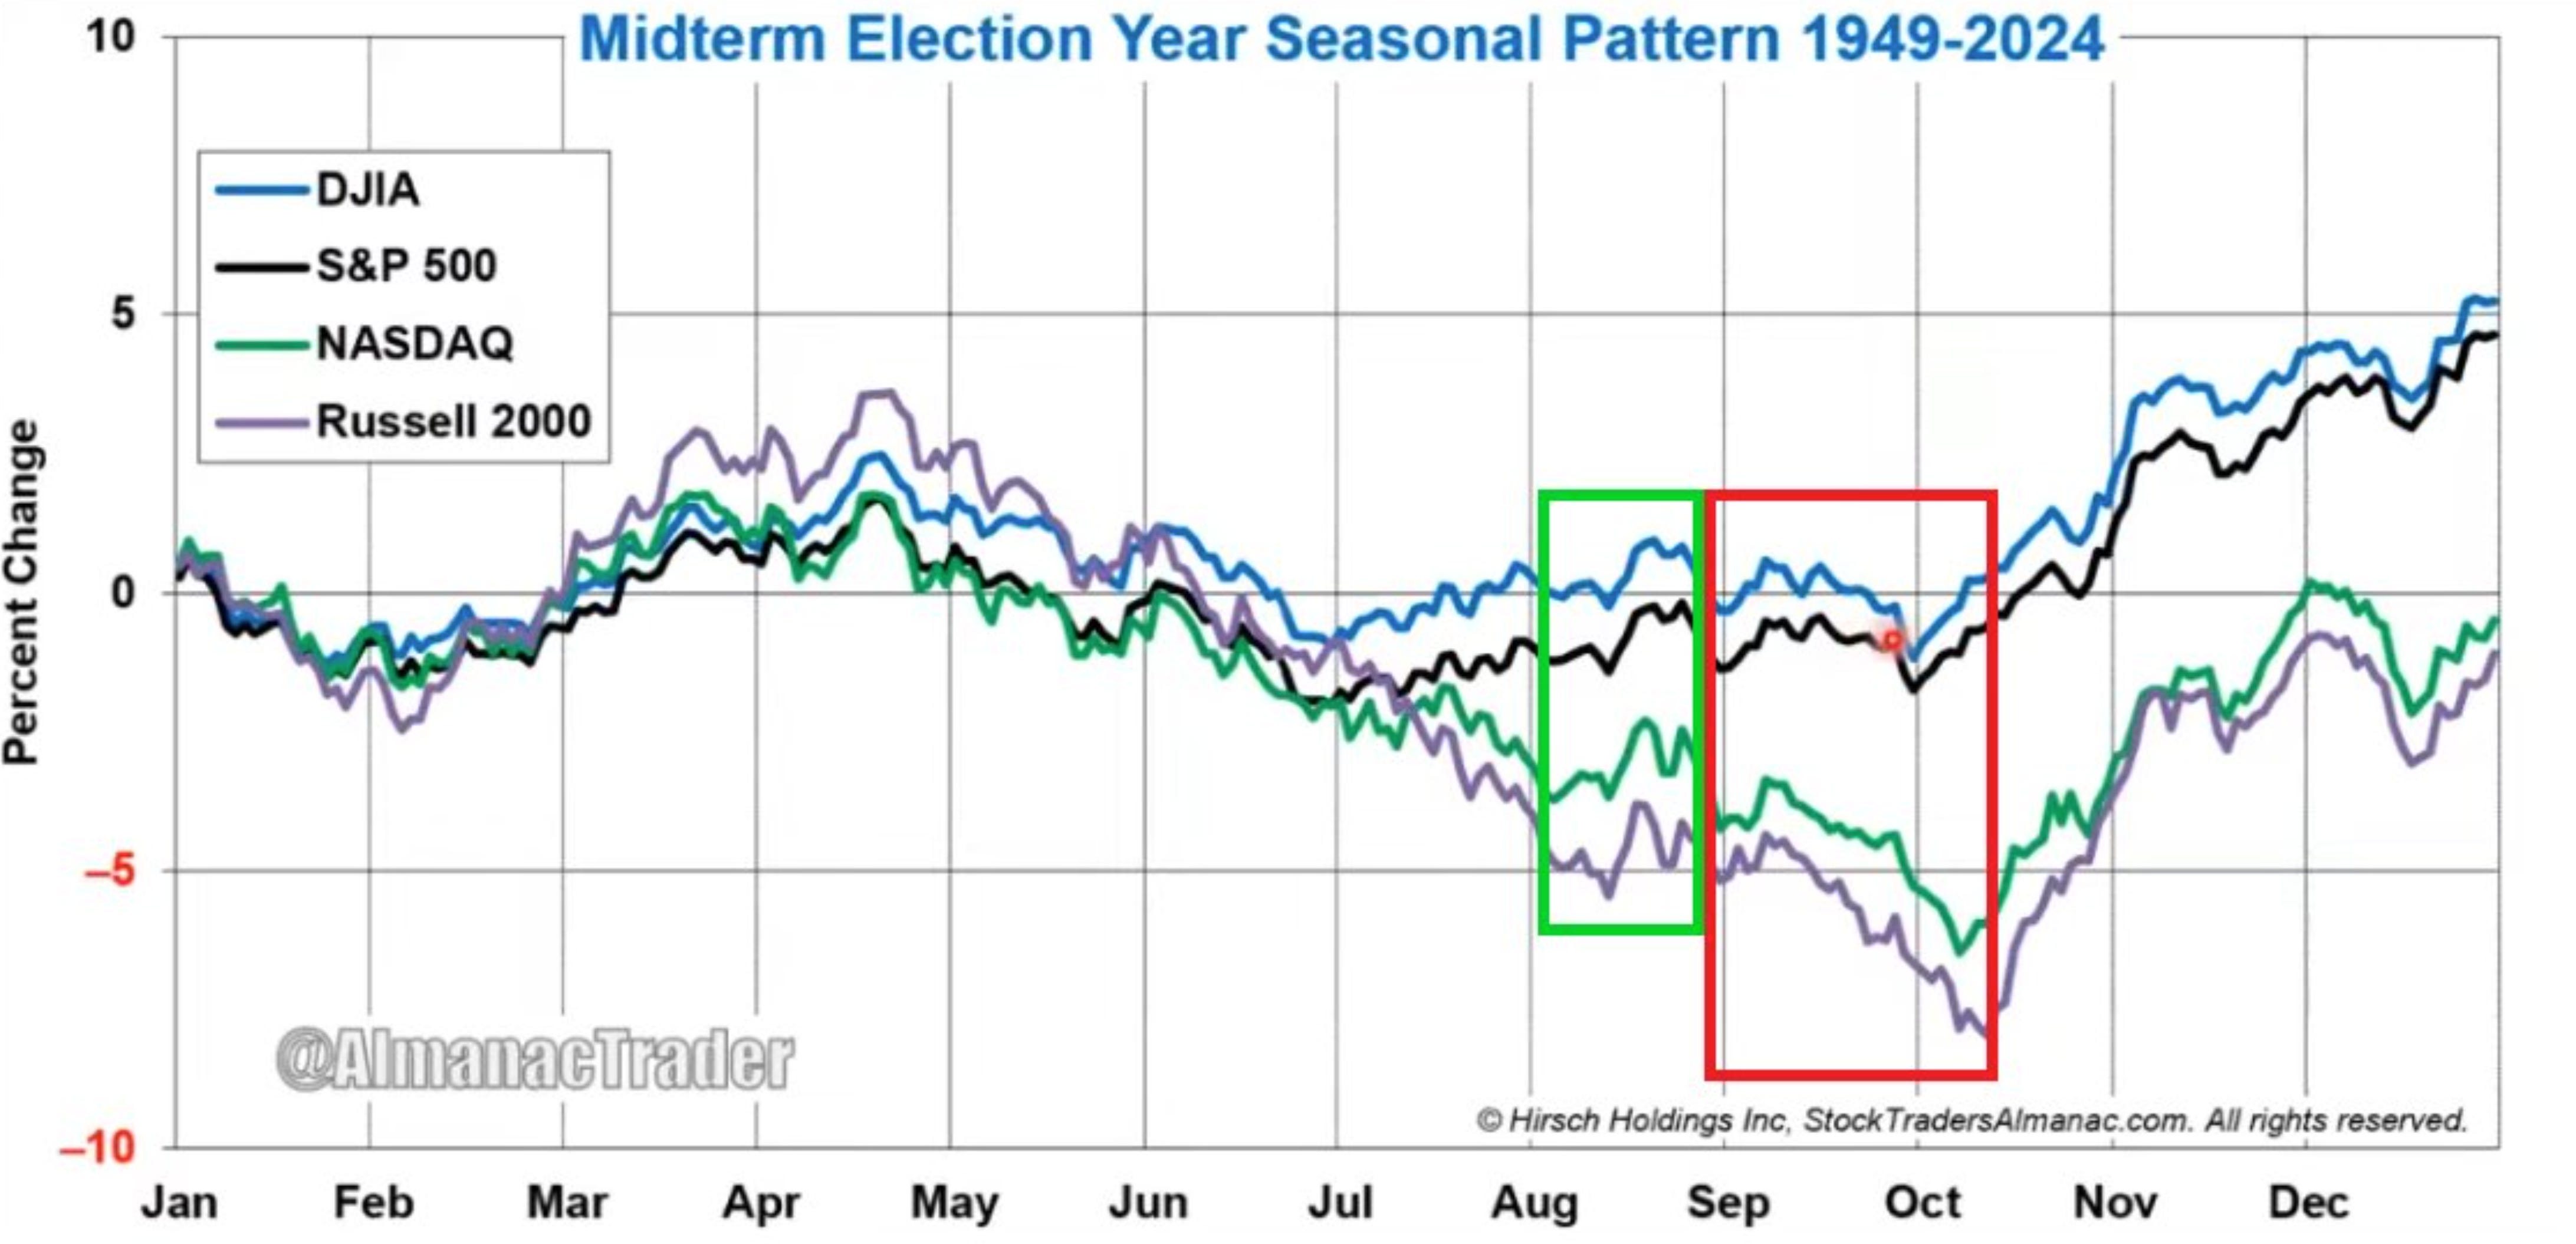
Midterm year seasonality for SPY, QQQ, IWM and DIA is historically bearish through September, with a low typically forming between late September and mid October, which has created excellent historical buying opportunities. If we do break down over the next 3 to 6 weeks, I’ll be buying some of my favorite names and indices on weakness and preparing for a strong rally into year end.
The short term trader in me will take some hits along the way, but the position trader in me, the one who actually makes most of the money, will be quite happy if we do sell off over the next several weeks.
Midterm Election Year Seasonality