
Patience
RLT Newsletter 5.7.26


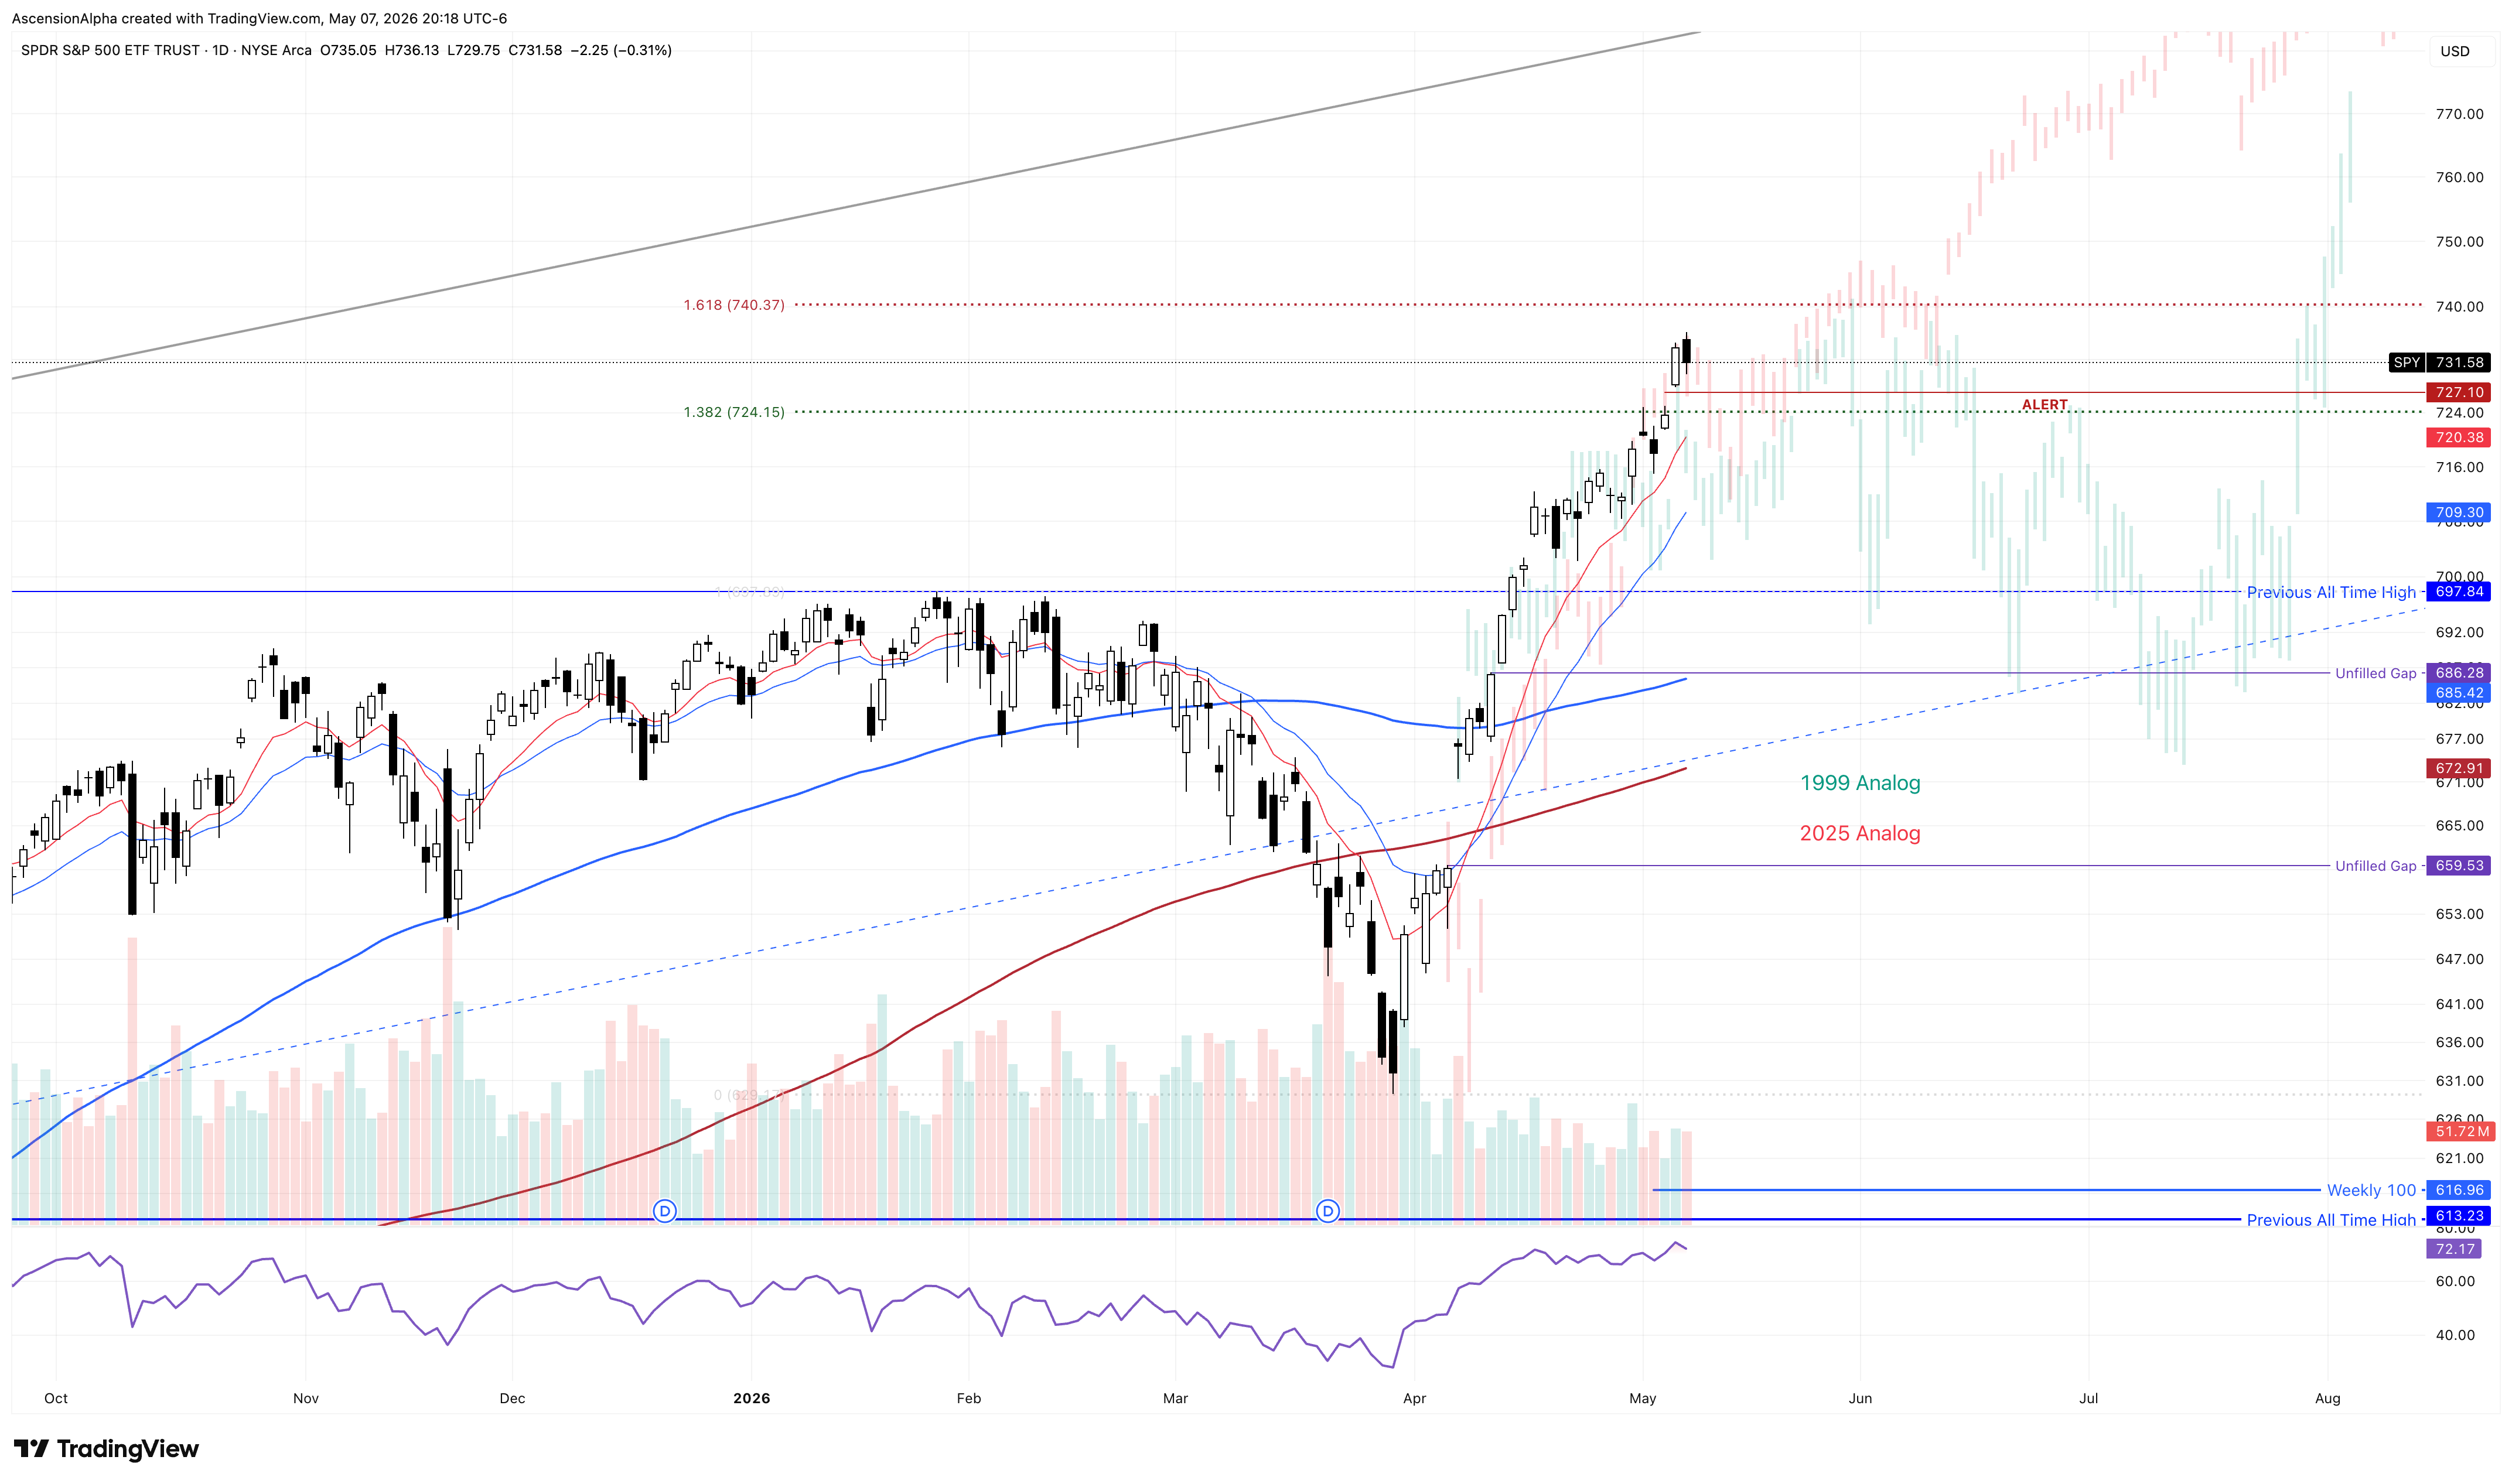
Thursday’s price action didn’t really change much on the broad market. Technically, SPY closed slightly lower, but it still made a new all-time high and still closed above Wednesday’s low. Until that level breaks, there really isn’t much to update from a structural standpoint. As long as Wednesday’s low continues to hold, I think it’s very possible we push directly toward the $740 area on SPY. That would line up with the 1.618 extension from the February and March selloff and could become an area where the market finally starts to slow down.
Pretty much every analog I’m tracking right now, including 1990, 1999, and 2025, suggests some kind of slowdown or correction in the $730 to $740 range. How that correction behaves will likely tell us a lot about what comes next.
At this point, I think it’s unlikely we get a clean drop all the way back to prior all-time highs right away, simply because too many people are expecting that exact move. The higher probability outcome, at least for now, is probably a shallower 3 to 4 percent correction that pulls SPY back toward roughly $710, maybe slightly lower, before another leg higher. In 2025, we saw a correction of about 3.3% from the highs before the trend resumed. If we assume something similar is beginning now, which is a big assumption given we still don’t have any real breakdown signals yet, that projects down toward roughly $712 before continuation higher.
The alternative scenario is a deeper retracement that undercuts prior all-time highs and pulls back into the longer term moving averages. That kind of move would likely spike fear and convince a lot of people this entire breakout was a fakeout before the uptrend eventually resumes. The problem is that it’s still too early to know which path we’re on. We need more price action, and more importantly, we need to see how the key leadership names behave.
If we start losing the longer term moving averages across the major indices, then the thesis changes and I’ll trade accordingly. But with SPY and QQQ not even touching their 10-EMAs yet, I still think the highest probability outcome remains a shallow retest followed by continued upside.
SPY Daily Chart
The next sustained move higher likely comes through market rotation. Most earnings are now out of the way, and many of the names driving this rally are extremely extended. The one mega cap that still has earnings and the power to significantly move the market is NVDA, and earnings are still about two weeks away. If NVDA is ripping into the $230 to $240 area before earnings, then I’ll be expecting weakness on its report. We all know how NVDA loves to gap and crap. For now, all I can really do is trail stops higher and see whether NVDA can continue pushing toward new all-time highs before earnings where I will take profits or lock in gains with a collar.
There are really only two solid approaches in this market right now, and both require patience. The first is looking for names that haven’t participated in the massive momentum rally yet but could benefit from rotation as money starts flowing out of semis and AI hardware. These are likely slower moving, beaten down names like software stocks. The challenge is that they usually take longer to work. They have heavy resistance overhead, which makes them move slower, and they require patience because you’re buying into weakness rather than strength.
The second approach is waiting for the momentum leaders to cool off, consolidate, retest key EMAs, and set up again for the next leg higher.
Personally, I’ll be doing both. The thread connecting these two approaches is the same: rotation. If money starts leaving the most extended names, it has to go somewhere, and right now the more AI resistant software names look like a possible destination.
Micron Technology, Inc
As far as momentum names go, MU remains at the top of my watchlist. If MU breaks below $603, I’ll start looking for a retest into the 20-EMA, which it hasn’t touched since reclaiming it after the April 8th gap. Ideally, I’d like to see it consolidate around that level similarly to how it behaved around prior 10-EMA tests, chopping sideways for a few days before continuing higher.
As long as MU holds above roughly $500, I think the momentum trend can continue. Below that, the stock may need a larger reset and consolidation before the next move higher begins. Even a move down to $500 would still represent roughly a 25% correction from current levels, which shows just how extended this name has become. But it’s also at the center of one of the hottest themes in the market, and institutions clearly still want exposure. A dip into the 20-EMA and a fill of the gap around $550 would still look tradable to me.
MU Daily Chart

Microsoft Corp.
The rotation name I’m watching most closely right now is MSFT. If you’ve been reading this newsletter for a while, you know I traded MSFT heavily through February, March, and April. That ended up being a strong trade, but it required patience because it involved buying into a downtrend. That’s still the case here.
MSFT recently ran into resistance at the 100-day SMA and rejected. Now it looks like it may be forming a bull flag after the sharp move off the lows into earnings. Naturally, earnings initially gapped down because it’s a software stock, but importantly, price has held the low of the earnings candle and actually closed above the bulk of that earnings volume for the first time on Thursday. As long as bulls can keep MSFT above the earnings candle low, I think there’s room for a move into the 100-week SMA and potentially even the gap fill around $480 if momentum builds.
There’s still plenty of resistance overhead. The first major hurdle is reclaiming the 100-day SMA. A close above that level and above Thursday’s candle would be a solid first step. Above there, the next resistance area comes in around the anchored VWAP from the October highs near $434, followed by the 100-week SMA. If we assume the earnings candle marked the low of a B wave, then the C wave likely targets at least $450, with probabilities favoring a full gap fill for a more symmetrical move. If instead this is the beginning of a larger impulsive move off the lows, then we may only get a move toward the 100-week SMA before another pause. Either way, the pattern still looks incomplete and suggests higher prices are likely ahead.
Stop levels to know: if MSFT loses the earnings candle low, I’ll look to re-enter around the 200-day SMA as a deeper B wave setup. If it loses the 200-day SMA decisively, it goes on the do not trade list until it reclaims that level. Clear trigger, clear rule.
MSFT Daily Chart

This kind of vertical price action creates FOMO and emotional decision making for everyone. I’m up roughly 25% on the year, and when I look at some of these AI names, it’s easy to feel like that number should be much higher. There’s always that voice asking why you weren’t fully loaded into MU (up 130%) or SNDK (up 480%).
Whenever I start feeling that, I try to channel it into something productive. The first thing I do is analyze how I could have improved execution. In this case, trailing stops instead of taking profits too quickly would have kept me involved in several positions longer. That’s something I’m actively working on. The second thing is making sure that feeling doesn’t start driving decisions. Chasing because you feel behind is one of the fastest ways to turn a good year into a bad one.
The key right now is selectivity. Stay patient, monitor key levels, and be ready when the next planned setup appears.
good stuff
I love the way you pull things together. You make it seem logical when it looks chaotic!