


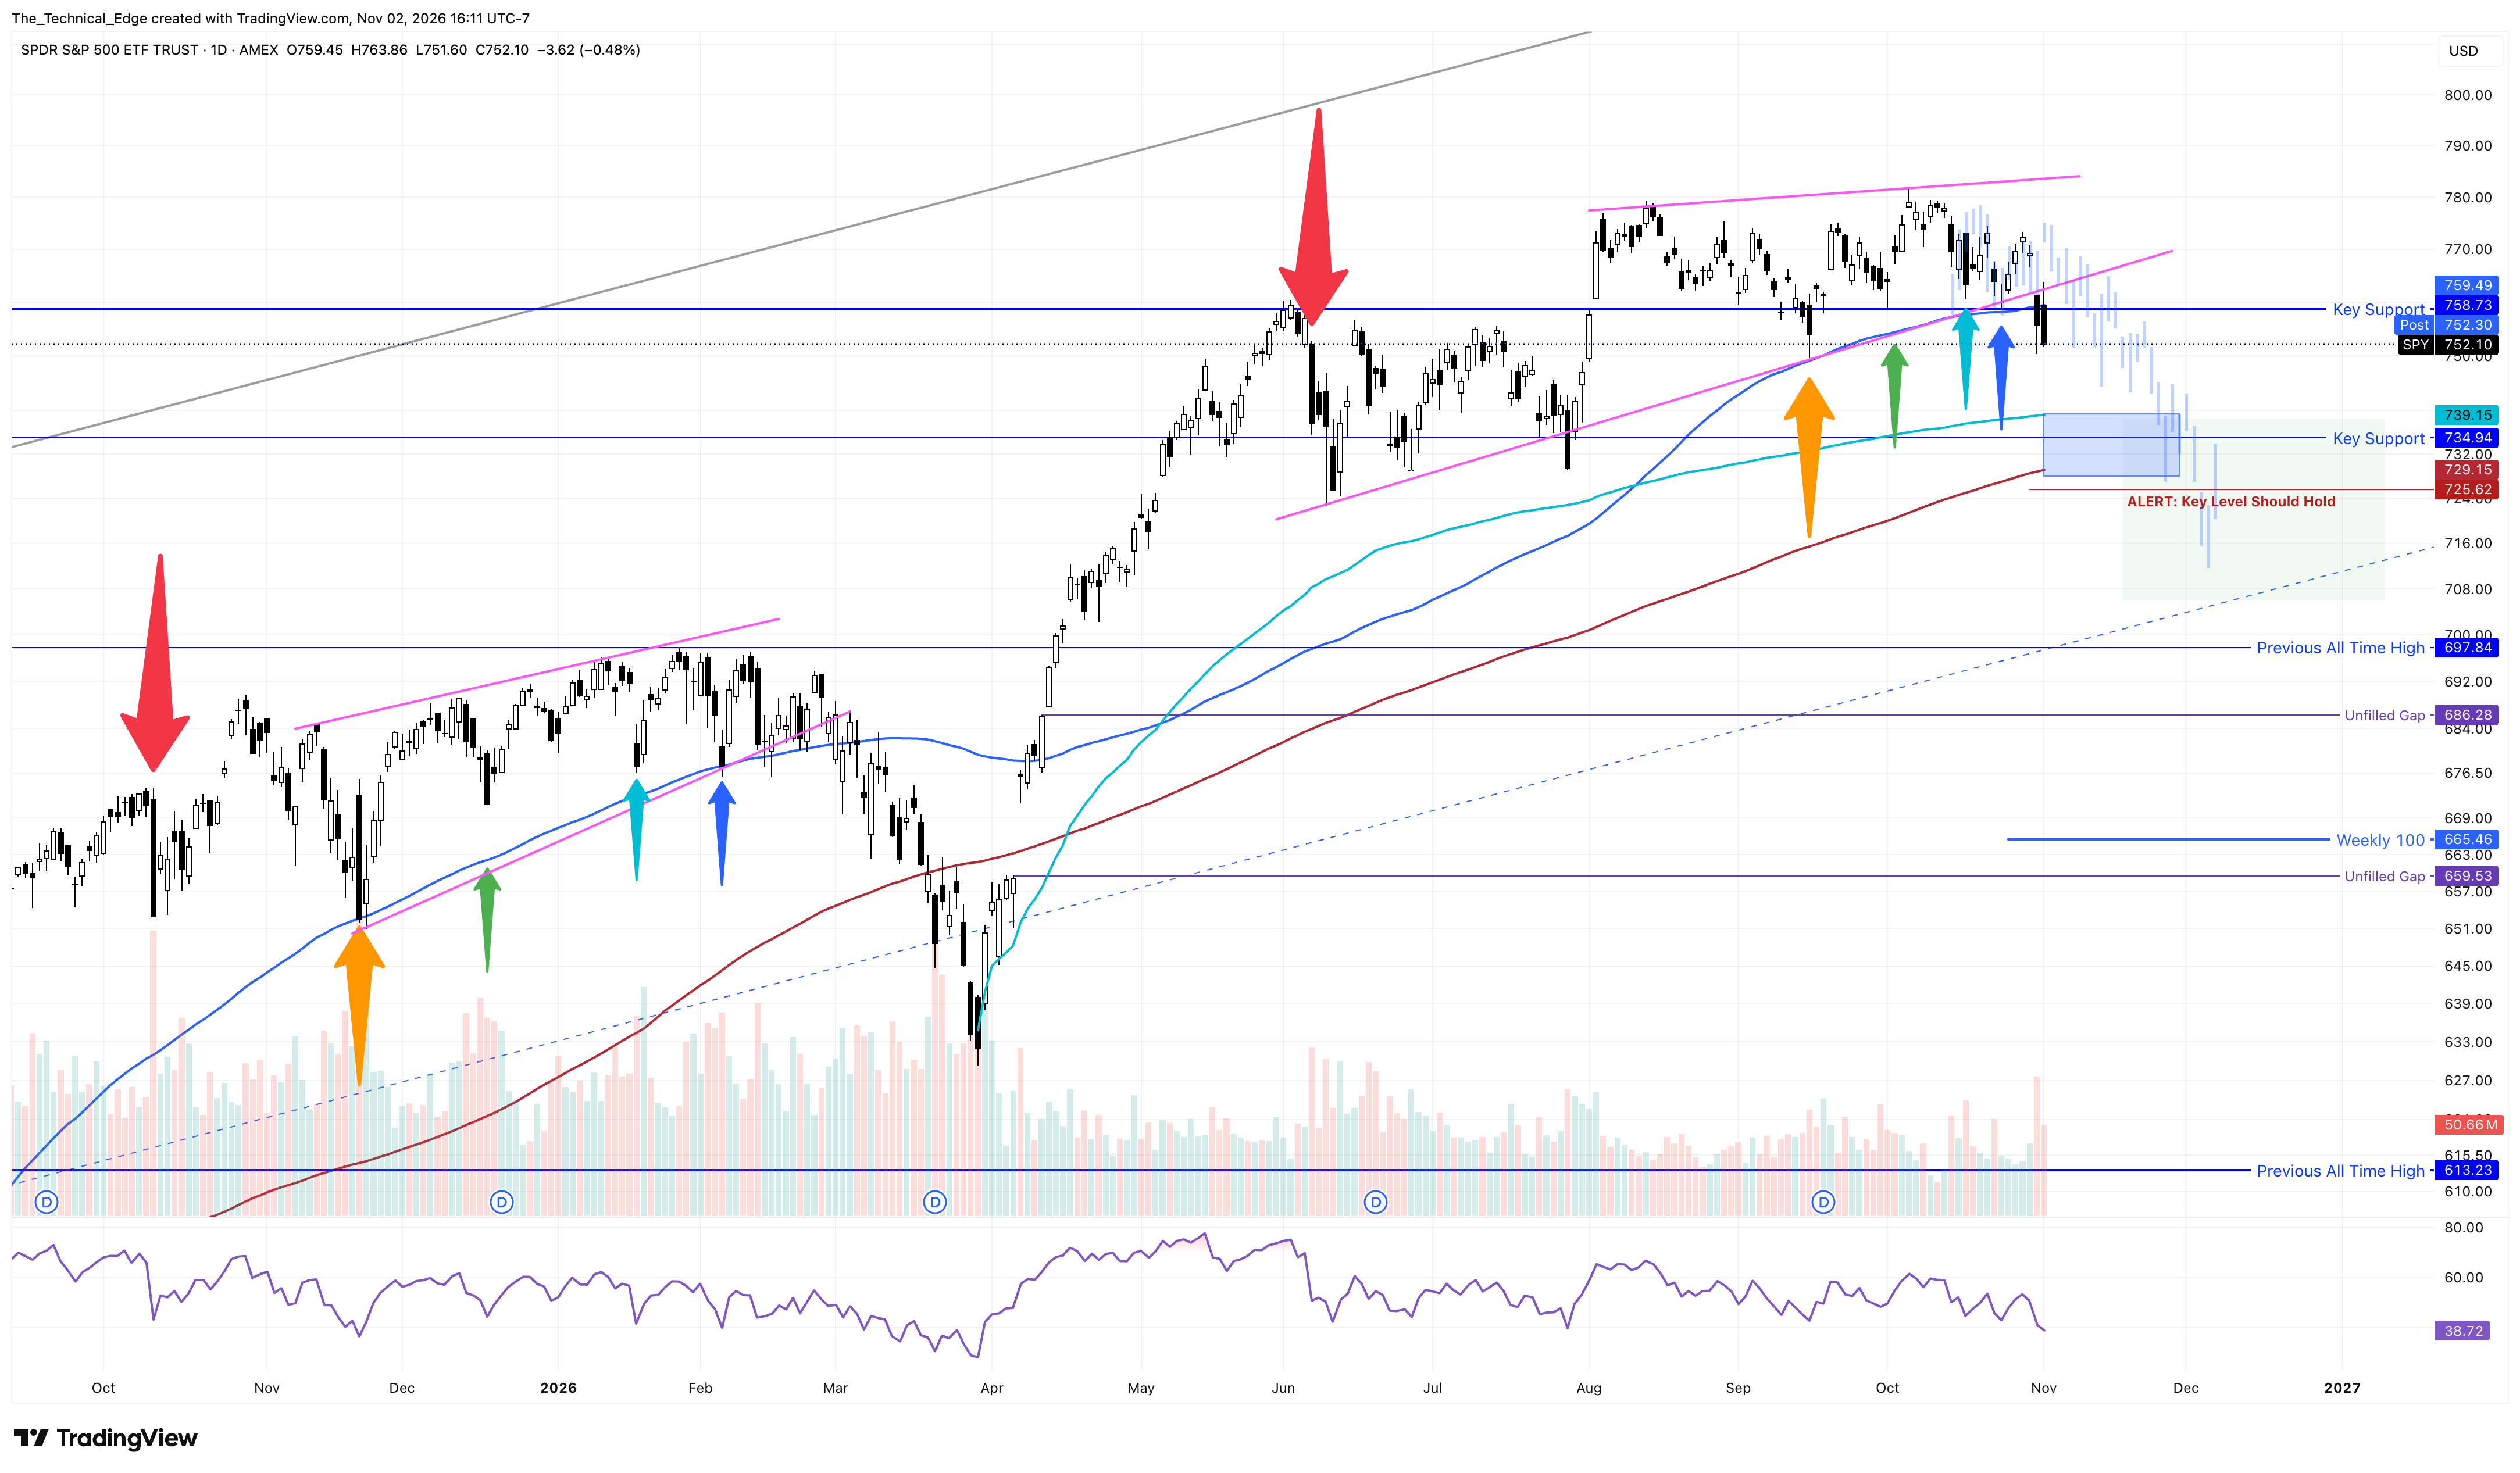
SPY has now closed below its 100-day SMA for two consecutive days, QQQ has just reached its 200-day SMA, and SOXX has sliced through both its 200-day SMA and the key $465 support level. Add in the major double tops forming across the AI trade, and there are plenty of reasons for caution.
SPY Daily Chart
Looking back to 2011, we can see that QQQ has found solid support and pushed higher four times when coming into contact with its 200-day SMA. The other seven times it touched the 200-day SMA, it sliced through and headed lower, usually in fairly short order. That’s not exactly a conclusive edge, but it does tilt the probabilities a little toward continued weakness in tech.
If QQQ breaks its 200-day SMA, it will also be forming a massive six-month double top. That’s a seriously bearish chart pattern if it plays out.
So the big question now is whether this turns into one of the more aggressive bear traps we’ve seen in a while, trapping shorts below the double-top necklines before reversing higher. Or do the very obvious double tops showing up across the tech sector actually play out?
QQQ Daily Chart: 200-day SMA Interactions

Thin Support Below
Support is extremely thin in the AI charts. Take SOXX, for example. There are roughly 12 candles spanning a $100 range that could potentially act as support. That’s not much to work with. The chart might as well have a gap given how little price structure exists in that area.
The next meaningful support is down around $368, another 20% lower. That’s a significant move, but it’s not out of the question at this point.
SOXX Daily Chart

AAPL Earnings
AAPL is gapping down this afternoon following earnings. The market hasn’t cared much about what AAPL does lately, considering it has been one of the inverse AI plays over the past few months. But even AAPL isn’t immune to the bearish pressure hitting tech right now.
The stock may be gapping down into its 100-day SMA and the AVWAP from its prior earnings report. If it can’t hold that area and $317 fails, AAPL could see a proper sell-off back toward its 200-day SMA.
Historically, when AAPL starts getting into that 15-20% drawdown range, the longer-term risk/reward starts to get pretty interesting. Its 200-day SMA is currently about 16% below its all-time high.
AAPL Daily Chart

The Next Round of AI Winners
To sum it up, this market went absolutely bananas in the spring, with many AI charts getting way over their skis. What we’re seeing now is a retest of that massive move, along with the market figuring out which moves were justified and which were driven by hype.
I suspect the market will be much more selective in picking the next round of AI winners. Make sure the names you’re interested in aren’t overhyped, debt-ridden garbage with AI slapped on the side.
The double tops showing up across the market, including SOXX and QQQ, are alarming and warrant caution. These are not patterns I want to ignore, especially with support starting to give way and very little structure below current prices.
As long as the risk of a larger breakdown remains on the table and the bears continue to control the price action, I’ll stay hedged and cautious. The lower we go, the more interested I’ll get in looking for long opportunities. But those positions will be protected, and I’ll be quick to reduce risk if key support levels start breaking.
There will be plenty of opportunities when the dust settles. Right now, protecting capital and staying flexible is the priority.