


If Friday’s low, where QQQ hit the 100-week SMA, was not a short-term low, I think there is a good chance we see some kind of short-term low early this week. Whether that turns into THE low is anyone’s guess, but seeing a bit more weakness would not surprise me.
SPY Daily Chart

While QQQ has already kissed its 100-week SMA, SPY has yet to even introduce itself. A drop into SPY’s gap fill and 100-week SMA would mean roughly another 3-4% downside for SPY and 4-8% for QQQ.
QQQ Weekly Chart
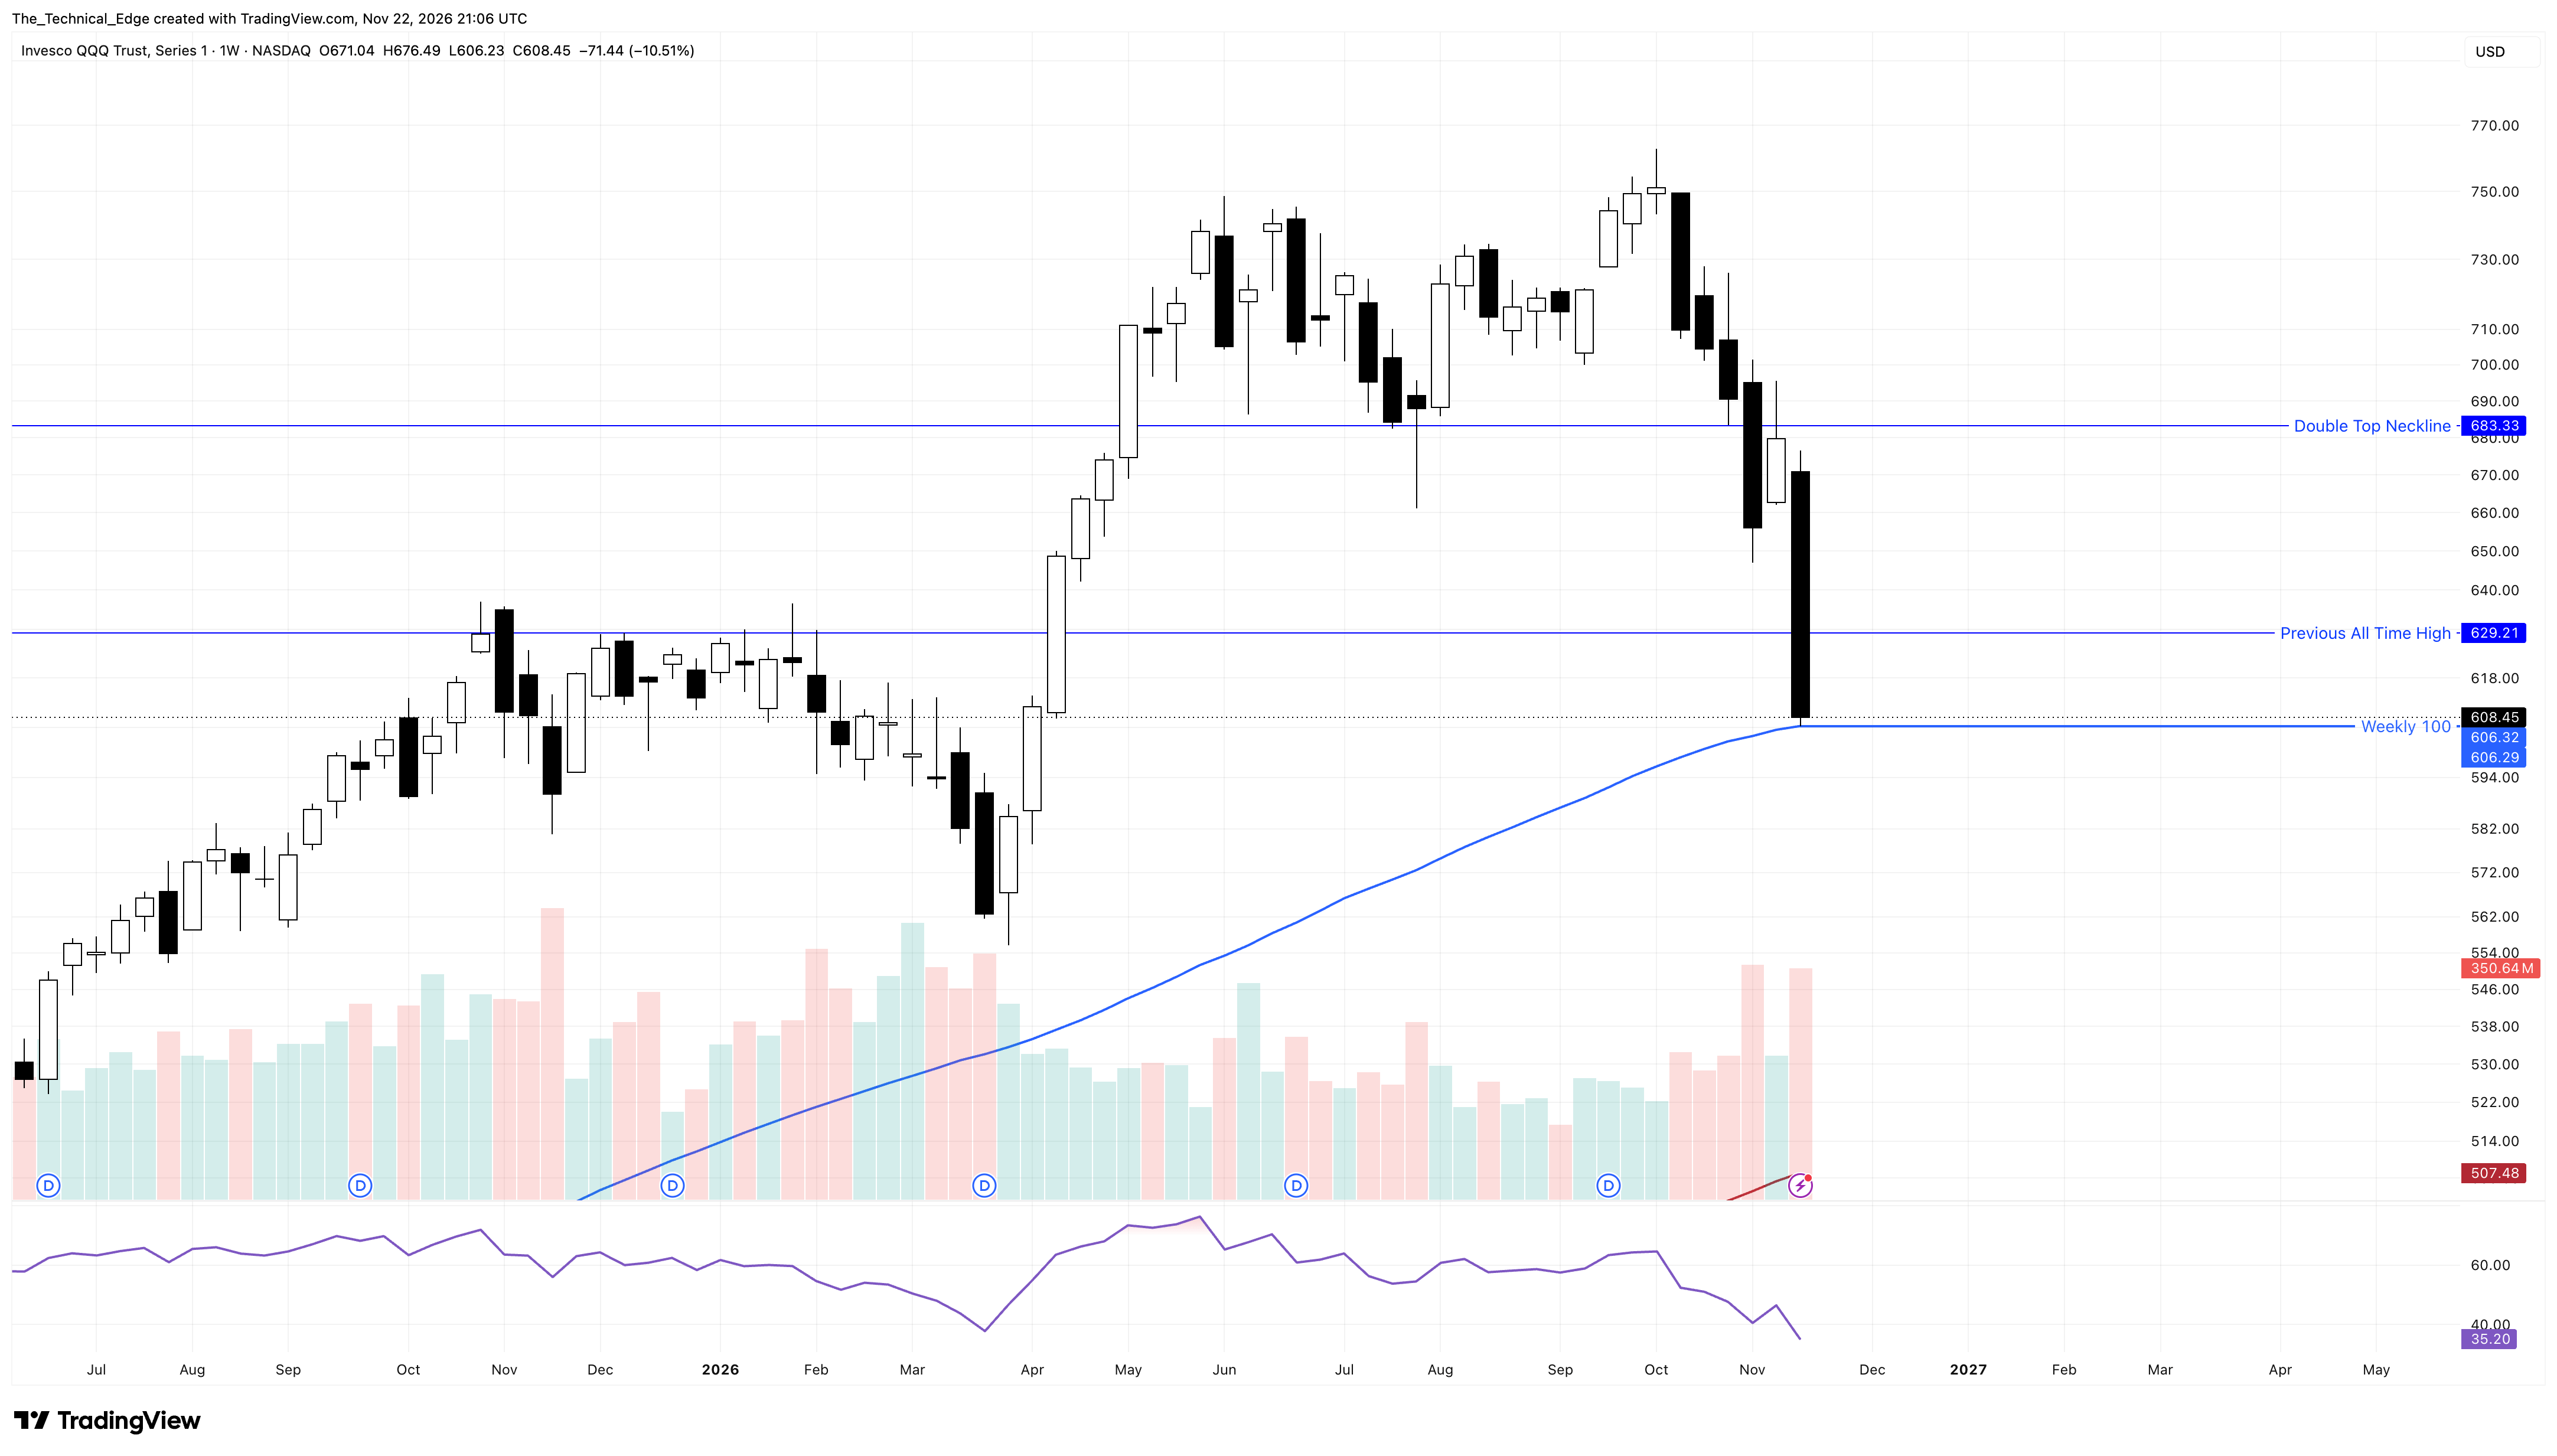
During the 2025 Liberation Day bear market, QQQ dropped 8% below the 100-week SMA before finding a durable bottom. That scenario is very much on the table now. In fact, QQQ has a storied history with the 100-week SMA and rarely bounces perfectly off of it.
The last interaction before 2025 was in 2022. QQQ did find solid support at that level and gave market participants a 17% bounce from the 100-week SMA before plunging 22% below it over the following months.
QQQ Weekly Chart - 2022 Bear Market

During the 2020 COVID crash, QQQ pushed 10% below the average for two weeks before V-bottoming.
In 2018, QQQ dropped 8% below it for three weeks before V-bottoming. In 2016, it had two separate drops below the key average, one of 4% and another of 7%. In 2015, we saw a 13% drop below the average that happened extremely quickly, in nearly one day.
The last, and only, perfect pullback into the 100-week SMA since the 2009 lows happened in 2011. QQQ touched the average perfectly three weeks in a row, then retested it again six weeks later. It held like a brick wall the entire time.
QQQ Weekly Chart - 2009 Perfect Support

So, while the 100-week SMA has not been perfect support for QQQ, as nothing ever is, the market has generally not spent much time below it since 2009 outside of the 2022 bear market.
That is the main question every trader and investor should be asking right now: Is this the beginning of a prolonged bear market, or is it a quick crash and buying opportunity before another great rally in 2027?
I don’t know the answer. I lean toward the latter, but I will manage risk as if it’s the former.
The Setup for the Next Leg Higher
When looking at the market, I like to plan for the worst-case scenario and then find ways to make money whether that plays out or the best-case scenario unfolds. I think an opportunity to do that is coming soon.
A good portion of the immediate downside has already played out based on historical drops.
Even in 2022, QQQ only fell 22% before launching into a face-ripping short-covering rally that gained 17% as we talked about above. It was just enough to lull traders back into complacency and get bulls buying out of FOMO before the next massive drop. That bear market rally retraced 61.8% of the initial decline before the next leg lower began.
The same thing happened in 2008. QQQ dropped 25% before a massive 23% rally sucked in all the bulls, only for the real crash to begin in the fall of 2008. That bear market rally retraced just over 61.8% of the initial decline. To be exact, it retraced 71% of the move.
QQQ Daily Chart - 2008 Crash

The same thing happened in 2000, but in a much more volatile and violent fashion. The market dropped 39% (not counting a massive downside wick) over a 61-day period, closing below the 200-day SMA. It then rallied approximately 42% over the following few months, all before the main crash really got underway.
Where did that rally take price, you ask? Come on, why do you ask? You already know. Right to just above the 61.8% retracement level, and more precisely, the 70% level.
All this is to say that whether this is the start of a large bear market or not, the current drop should, based on history, be getting close to ending, making way for the next wave higher. Just look at what happened in my 1998 SPY analog when it became this stretched. Price rallied 14% back into the 200-day SMA.
SPY Daily Chart - 1998 Analog

Whether that wave makes a lower high or a higher high is not something I am going to bother speculating on right now. I think there is money to be made if we retrace 61.8% of the recent bearish move. If we drop to the gap fill at $588 on QQQ, that retracement would take us right back into the 200-day SMA from below.
Talk about some convenient confluence!
QQQ Daily Chart

Savant