The volatility continues as SPY and QQQ blasted higher on Wednesday. While this was certainly a bullish development, I’m not convinced we’re out of the woods yet when it comes to a more bearish scenario.
The 2018 analog had not one, but TWO traps where it gapped over the 200-day SMA. On top of that, I found a new analog while studying SPY’s history that fits this price action extremely well. It also lines up with my thesis that if we do go lower, this dip is very buyable.
This current bullish move is essentially a neckline retest of several major double tops across the market, including SPY, SPMO, MU, and SOXX. All of that keeps me a bit cautious. However, I also have to respect the gap above QQQ’s 200-day SMA as a bullish development and a reason to be more bullish today than I was just 24 hours ago.
However, if QQQ drops below the 200-day SMA over the next few days, I’ll be roaring again and swinging my bear paws around buying all the puts. In fact, I may have purchased a put or two on SPY today when it retested the 100-day SMA, the AVWAP from the highs, and the double-top neckline. The market was practically daring me to short, and I ain’t no chicken.
QQQ Daily Chart

SPY: The 1998 Analog Is Spooky Accurate…So Far
Let’s take a closer look at my newest analog on SPY: the 1998 price action.
I like it when my analogs have more than just price action lining up. For example, the 2018 analog has several similarities beyond the charts: rate hikes, midterm elections, Trump’s first term, and a new Fed chair, among other things.
Well, 1998 has the dot-com boom, and we’re currently in the AI boom. More importantly, 1998 was not the end of the bull market, and I don’t think we’re at the end of the AI boom either.
My thesis is that whatever dip we get could ultimately become a fantastic buying opportunity for longer-term AI investments heading into 2027 and 2028, possibly even longer, before a substantial top forms, much like what we saw in 2000.
Now, let’s look at the chart.
SPY Daily Chart - 1998 Analog

I started by searching for candles that looked similar to what we saw on Thursday, November 5th, and honestly, the August 4, 1998 candle is the best fit. It’s not even close.
Add to that the absolutely parabolic, vertical run-up we saw (green box), followed by choppy consolidation (yellow box), and then the final move higher accompanied by bearish RSI divergence (blue box).
Here’s what’s particularly interesting: the green, yellow, and blue boxes for both 1998 and today each span 190 days. Sometimes these analogs are spooky accurate.
What happened after the August 4, 1998 death candle? SPY dropped to NEAR the 100-day SMA but didn’t quite touch it. It then bounced back into the 100-day SMA, rejected, and headed lower. Eventually, it broke the 200-day SMA and pushed vertically lower, much like what we saw during the 2018 correction.
So far we are seeing the same thing after our November 5th death candle. If the charts continue to line up, this could put us on a bearish path into the end of 2026. Keep in mind, that would potentially create a fantastic buying opportunity for the next leg of the AI bull run over the following year or two.
So far, in after-hours trading, NVDA is dive-bombing on the latest news surrounding Jensen Huang and his extracurricular activities. This is putting pressure on the broader market and the AI trade.
SPY and QQQ are both looking weak. If they gap lower tomorrow and the bulls don’t step in, that would be a big warning sign that history may be rhyming once again.
NVDA: A New Layer of Uncertainty
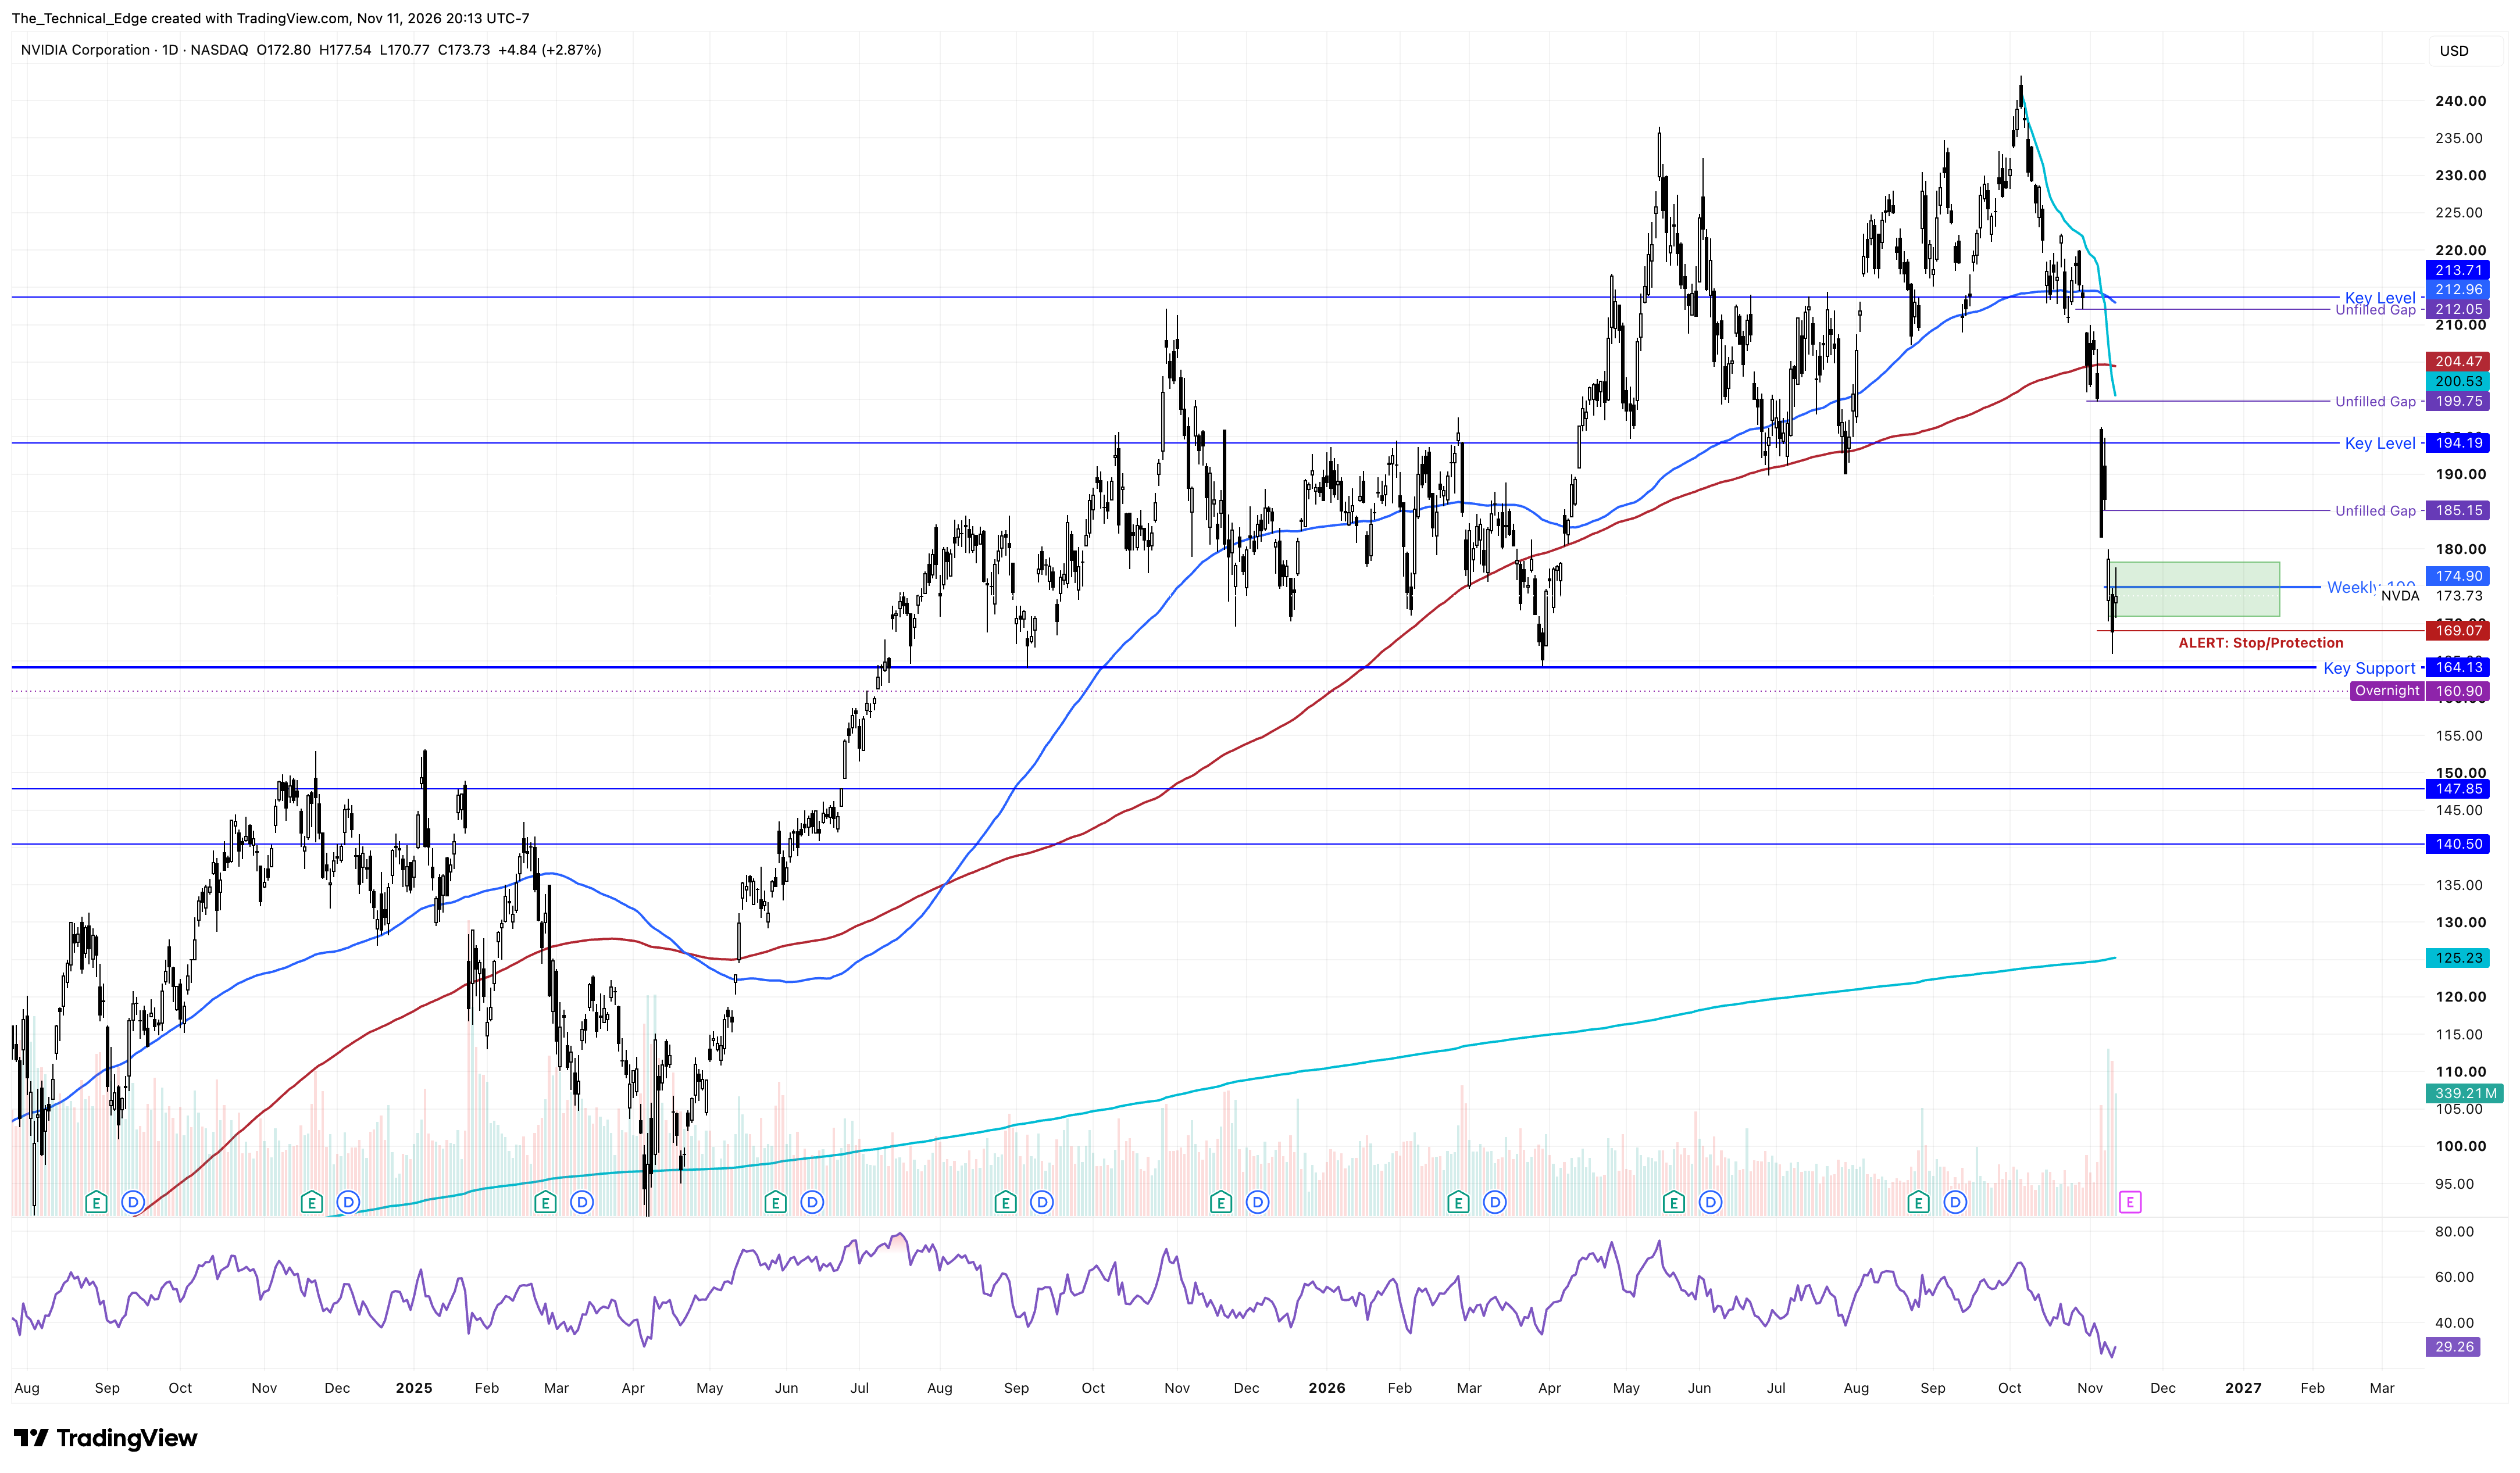
As far as NVDA goes, I bought puts at Tuesday’s open because that was not a good gap for the bulls, and we’ve seen weak price action ever since. I took the loss on my long position and am currently short.
I shared those updateds with the entire RLT Swing Trade Community in real time.
Now we have another layer of uncertainty surrounding Jensen Huang and the companies immediate future. Reports have emerged of an additional alleged relationship with a subordinate, on top of the previously reported relationship that Huang acknowledged. Nvidia’s board is reportedly considering his future as CEO, although no decision has been announced as of this writing.
There is plenty of precedent for CEOs losing their jobs over workplace relationships, affairs, or violations of company relationship policies. Here are several notable examples:
Mark Hurd (HP, 2010)
Brian Krzanich (Intel, 2018)
Steve Easterbrook (McDonald’s, 2019)
Bernard Looney (BP, 2023)
Andy Byron (Astronomer, 2025)
Jensen Huang (NVIDIA, 2026?)
I think this situation could become a significant problem for Jensen and Nvidia. A potential departure would certainly shake up the market in the short term.
That said, Nvidia is not the AI industry. Having a founder CEO with a clear vision is a huge advantage, and losing Jensen could weaken NVDA’s leadership position. But AI isn’t dead because one CEO makes some very bad personal decisions.
For now, I’m looking at AMD and AVGO as potential beneficiaries of where money from NVDA will flow.
NVDA Daily Chart