
Warsh Cycle
RLT Newsletter 6.17.26


Tuesday’s price action gave us the retest that I was expecting, with the major indices and most of the key names I follow successfully holding their important support levels. However, Wednesday’s open and early price action started to flash some warning signs that more bearish price action was coming.
With the FOMC meeting scheduled for Wednesday afternoon, quadruple witching on Thursday, and the market closed on Friday, I decided to lock in gains at Wednesday’s open on most of the swing trades I entered on Friday.
Would it have been better if I had sold everything at Monday’s close? Of course. But nobody consistently sells the exact top, and there was nothing in Monday’s price action suggesting that the bullish momentum could not continue for a while longer. Wednesday morning’s action was the first meaningful signal that something had changed.
I sent out several messages early Wednesday morning, including the one below. If you’re not already a member of Real Life Trading Swing Trade Room, be sure to check it out. That is where I provide real-time market analysis, even more trade ideas, charts and risk management updates as price action unfolds.
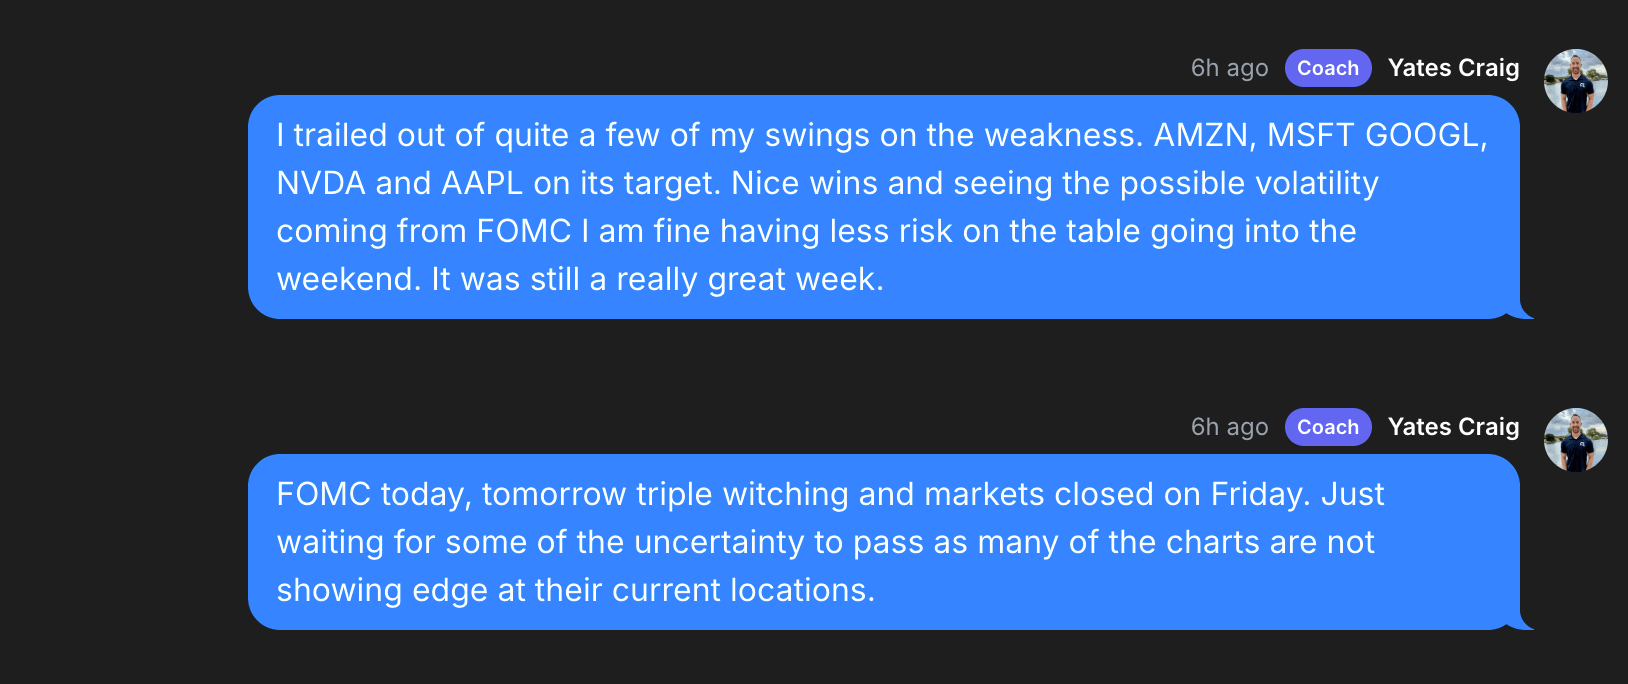
There was simply too much risk heading into the FOMC meeting. Combined with the fact that price action was showing early signs of weakness and the possibility that the entire rally from last week was merely a B-wave bounce or bear flag, I had no interest in watching profitable positions turn into losses. Protecting gains was the priority.
I had no way of knowing the market would sell off following the FOMC meeting, but the setup was certainly there. Since my number one job is to mitigate risk, that is exactly what I chose to do. I always try to maintain the mindset that I can re-enter later once uncertainty clears, even if it means buying back at higher prices.
SPY Two Paths Forward

GOOGL: Managing Risk
Take GOOGL as an example. I have been waiting for a breakout above the massive resistance level at $374, and so far it continues to fail there. On Tuesday, the stock briefly pushed above that level before rejecting once again. Then Wednesday morning opened with a bearish gap and go, which prompted me to exit my position ahead of the FOMC announcement.
If GOOGL eventually gaps above $374 and confirms the breakout, I can always re-enter the trade, define a new risk profile, establish a new stop, and target higher levels. Until then, I expect continued sideways consolidation and the possibility of a breakdown that could provide an even better entry opportunity.
GOOGL Daily Chart

What FOMC Actually Told Us
The FOMC meeting delivered a lot for markets to digest. For me, one of the most important takeaways came when Kevin Warsh stated, “The Fed has missed inflation targets for five years, and we are going to fix that.”
That statement, combined with what we know about Warsh’s policy views, suggests he is positioning himself as someone willing to aggressively address inflation and its root causes. At a minimum, it signals a willingness to maintain a more restrictive monetary policy.
The bond market certainly took notice. The 2-year Treasury yield surged back toward 4.2%, effectively pricing in the possibility of two rate hikes. Earlier this year, markets were pricing in roughly two rate cuts!
We also saw the U.S. Dollar Index (DXY) rally higher into the critical $100 level, an area that has acted as major resistance for nearly a full year.
Historically, tighter monetary policy tends to strengthen the dollar. Higher interest rates increase Treasury yields, which attracts foreign capital into U.S. assets and increases demand for dollars. Additionally, if the Federal Reserve tightens policy more aggressively than other central banks, the widening yield differential tends to push DXY higher.
We saw exactly this dynamic during 2021 and 2022 as the Fed aggressively tightened policy and DXY surged.
While the Fed is not explicitly signaling rate hikes today, the fact that nine of the eighteen voting members now project at least one rate hike this year suggests that “higher for longer” remains the dominant policy stance for now.
DXY Daily Chart

One More Signal Worth Watching
One final signal that I have to point out is that the DIA versus SPY Divergence Indicator I have used to great success int the past triggered once again this week.
Historically, every occurrence of this signal has led to at least a 4.5% pullback in DIA. A move of that magnitude today would simply bring DIA back to last Wednesday’s lows. However, the majority of historical occurrences eventually saw DIA revisit its 100-day SMA or lower which would represent a much more meaningful correction and would align with the downside targets I outlined when this correction first began on June 5th.
If you want a deeper explanation of the indicator and its historical performance, be sure to check out my newsletter below where I break down my DIA versus SPY Divergence Indicator in detail.
Divergence at the Top

Friday saw a broad-based move higher following four straight days of bearish action. Thursday’s selloff had become fairly overextended, so a bounce was likely—but the key question now is how long it will last.
DIA Daily Chart
