


QQQ and the majority of the market gapped down on Wednesday morning after a solid little run into all-time highs.
QQQ and SPY had just broken out to new all-time highs, so a retest of that breakout and a continued grind higher is perfectly normal and, frankly, to be expected. If the short-term trend is going to continue, short-term bulls would want to see QQQ hold the prior all-time high during this weakness. SPY should also hold the $766 level.
Below those two levels, and we could see a bit more volatility coming around the corner.
QQQ Daily Chart

On days like Wednesday, I like to look for strong names that are showing great intraday relative strength. That can mean a stock that doesn’t gap down with the broader market, or one that gaps down and then quickly turns positive, also known as a red-to-green move.
While the whole market got bought up, at least for the most part, there were still some offshoots showing excellent relative strength.
Memory Stocks Push Higher
One of those areas was memory.
I’ve been saying for months now that buying SNDK off the 100-day SMA has been a winning strategy, and that once again proved to be the case on Wednesday. Just 10 shares purchased off the 100-day SMA would have yielded roughly $600-$800 on Wednesday alone.
That said, there is something I’m watching closely. Volume has been decreasing each time SNDK bounces off the 100-day SMA. Combine that declining volume with the overall price pattern, and there is a possibility that we are forming a rising wedge that eventually gives way to the downside.
If that happens, I would actually view it as a great buying opportunity.
SNDK Daily Chart
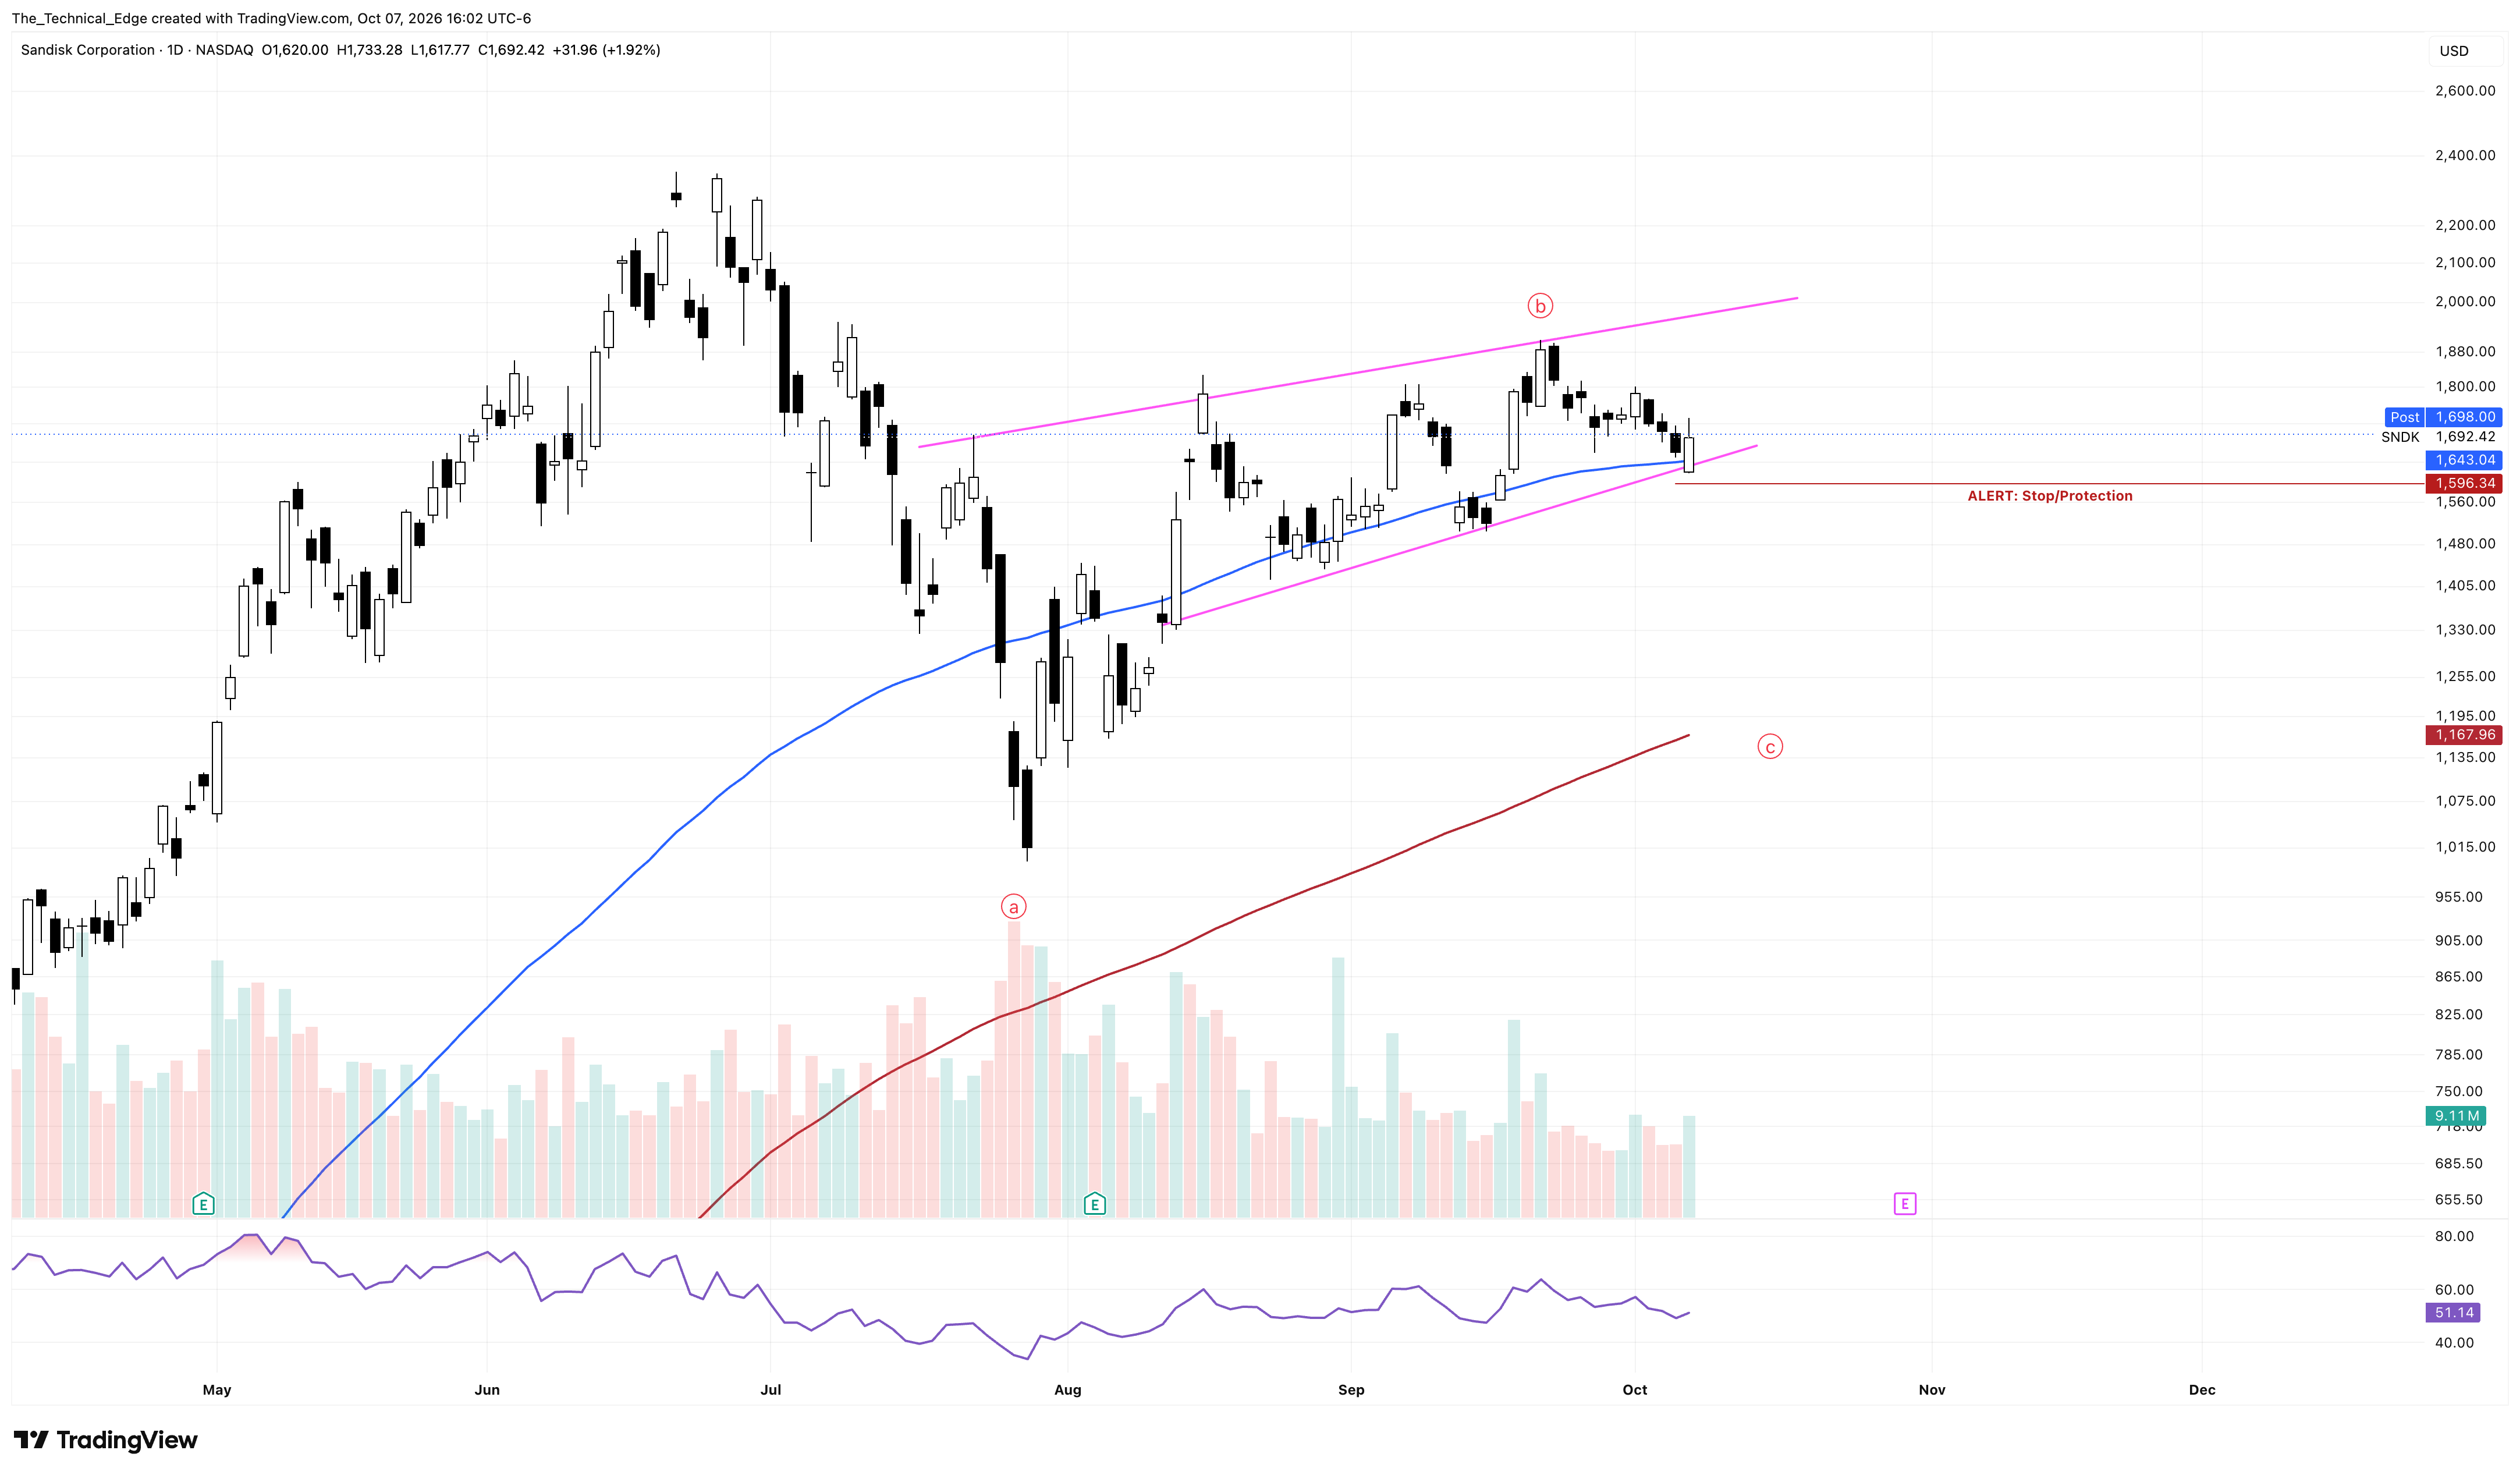
What I found particularly interesting was that the memory names didn’t really participate in the market’s push toward all-time highs on Tuesday. In fact, MU and several other memory names were down while the broader market was pushing higher.
Money rotated into memory names during Wednesday’s weakness, giving us bullish engulfing candles off support on both SNDK and MU, with MU being the stand out as far as strength into the close.
While Wednesday was the dip for the old saying “buy the dip,” I think that still applies to MU and SNDK as long as they remain above their 100-day SMAs.
MU is sitting in a tight wedge pattern and is nearing a point where it has to break one way or another. If it breaks down, we could get a nice wave lower toward the 200-day SMA. But if it breaks higher, I think a move into new all-time highs is very possible.
Either way, these are hot names with well-defined risk levels. Buyers have clearly been willing to step in, as we saw in Wednesday’s candle and in the earnings candle on MU.
That’s exactly the kind of relative strength I want to be paying attention to when the broader market gets choppy.
MU Daily Chart

Bitcoin: Retest Coming?
Bitcoin may be forming a small double top here, but it needs to break solidly below the $82,000 level for that setup to really come into play.
Even if the double top does trigger, the expected move would only take BTC down toward the $78,000 area. However, Wednesday’s weakness does signal that Bitcoin could be starting to see some consolidation.
Personally, I would love to see BTC chop lower into the $76,000-$71,000 range.
That is where the risk/reward starts getting quite attractive again. A move into that area would also create an interesting parallel to the beginning of the 2023 bull market and could set Bitcoin up for its next major move sometime in 2027.
There is another factor worth watching here: DXY.
The dollar index has been climbing higher day after day, and if you look at the historical relationship between DXY and Bitcoin, we know BTC generally does not like a bullish DXY environment.
Perhaps Bitcoin is able to shake that relationship this time around, but it’s still a signal worth respecting. If we start breaking some of the major bull-market support levels, I would pay very close attention.
DXY vs BTC Correlation

The Bull/Bear Line
I also have to mention the 120-SMA on the 3-day Bitcoin chart. If we start closing below that level, Bitcoin would be crossing back below the bull/bear line and into bear territory once again.
There was one instance in 2012 where Bitcoin crossed bullishly above the 120-SMA and then moved back below it without ever breaking the prior low made before the initial breakout. In other words the bear market was over with the first cross over, but it still retested below the key moving average for some time.
That would be my base case if we see a similar setup develop here.
If we look at the 2012 move, Bitcoin eventually retested the initial move off the low by almost 50%. In fact, it was a 48% retracement.
2012 Bitcoin Chart

If history were to repeat itself, a similar retracement from the current structure would take BTC down into roughly the $73,000 area.
Interestingly, that would line up almost perfectly with the daily long-term averages and the anchored VWAP from the major low, assuming the move happens in the relatively near future.
BTC Daily Chart

For now, the bullish trend remains firmly intact.
But Wednesday gave us a few things worth watching. QQQ and SPY need to hold their breakout levels. MU and SNDK are showing nice relative strength above their 100-day SMAs, with clearly defined hedge levels. Bitcoin is starting to show some weakness that could become very interesting if $82,000 gives way.