
Welcome to June
RLT Newsletter


Monday marks the start of new weekly and monthly candles. Can you believe we're already in June? This market has not given us more than three consecutive down days since the low, and the rocket ship higher continues.
Last week I mentioned that it is quite possible the SpaceX IPO marks a short-term top in this wild and crazy market, and I still think that theory remains very much in play. That is especially true if we continue grinding higher into the IPO date itself. Even Grok cannot seem to pinpoint exactly when the offering will happen, but it is confident that it is coming sometime in June.
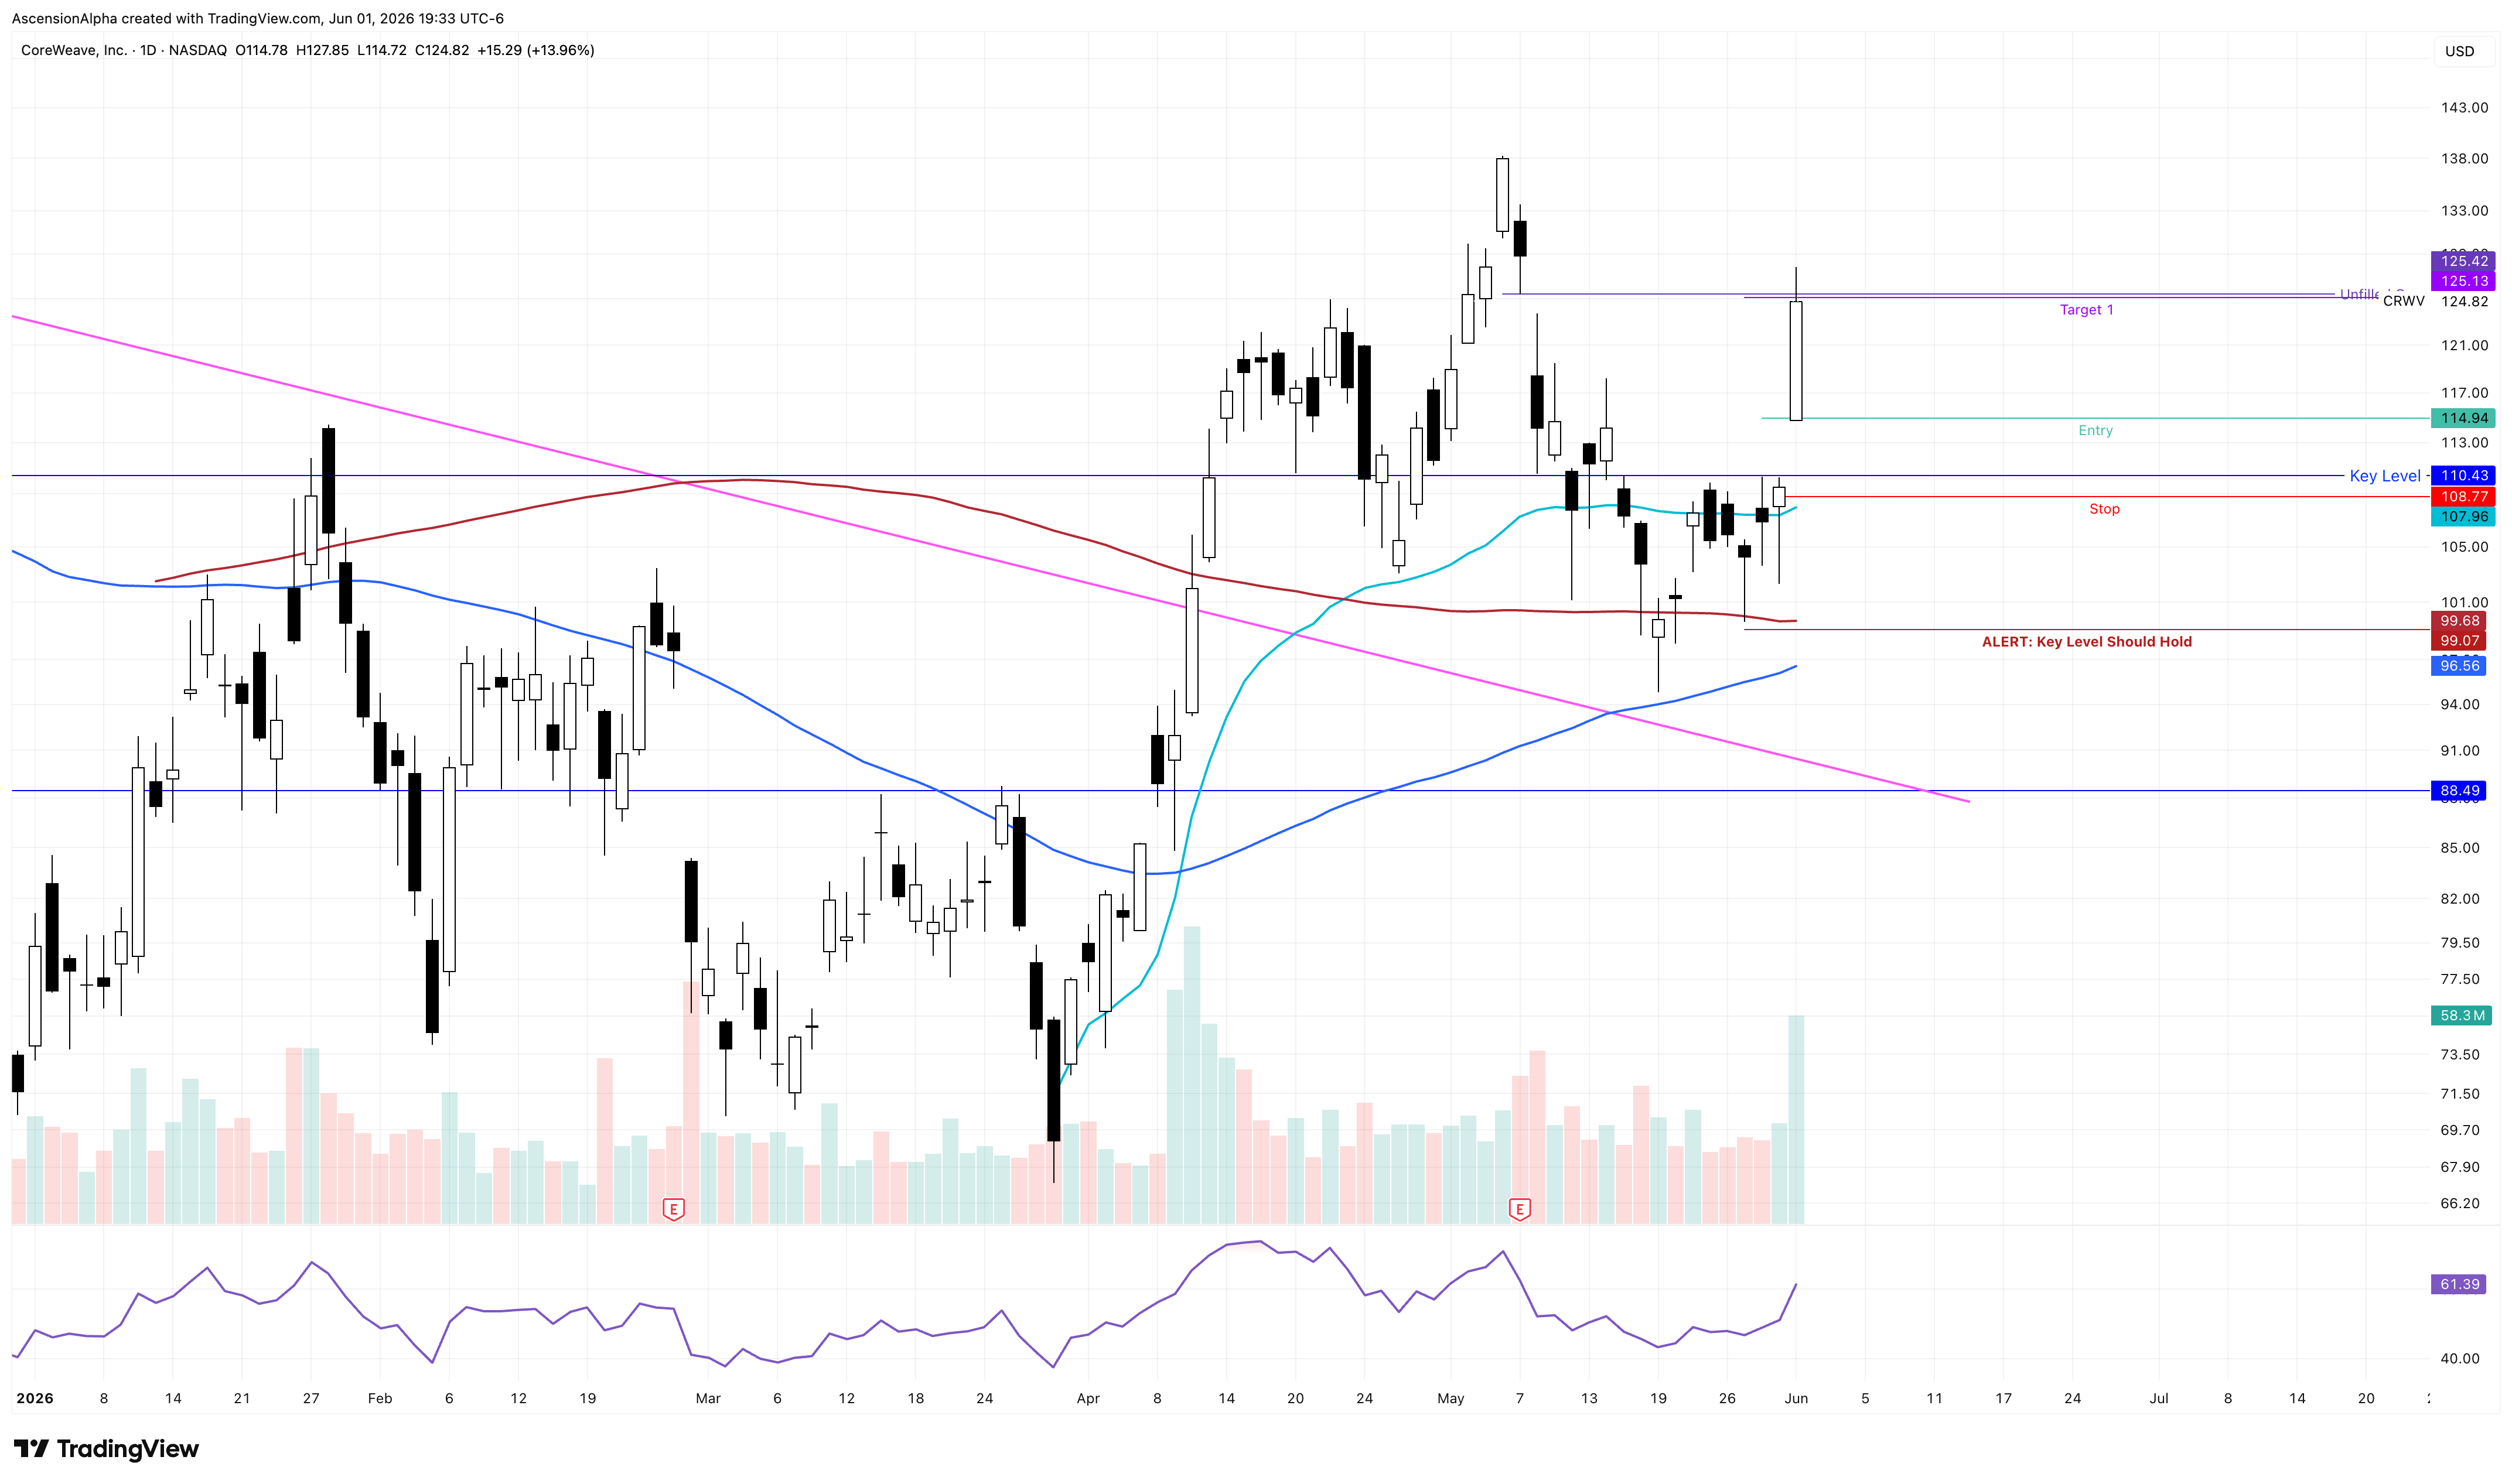
This is very much a trader’s market. What I mean by that is that the amount of edge available in gaps and individual daily price action has been tremendous lately. Full swing trades are playing out in a matter of hours rather than days. The CRWV trade I discussed on Sunday filled and hit target all on Monday for a roughly 10% gain.
I know many of you used my analysis to make that trade your own and absolutely crushed it, so congratulations.
CRWV Daily Chart
Most bullish traders have been on heaters recently. It is easy to start feeling invincible when nearly everything you touch works. That is what an exceptionally strong bull market does. It also makes it incredibly easy to develop FOMO and beat yourself up over missed opportunities.
The reality is that we miss out on trillions of dollars worth of market moves every single day. What matters is not the trades we missed. What matters is our process, identifying high-probability opportunities, and how we manage both our emotions and our risk once we enter a position.
At this point, most of the charts I have been watching closely have either already hit their targets or simply failed to work out. Looking at you, META.
Because of that, I am planning to be more conservative during June.
My primary focus will be on high-quality gap setups that can be traded aggressively as swing trades or day trades. Recent examples include ONDS and CRWV. TWLO is another great example, although unfortunately I did not catch that one. It is one of the best recent examples of a momentum stock consolidating and pulling back into the short term averages before gapping higher and continuing with the bullish momentum.
When I trade these setups, I will generally buy near the open and place my stop either below the 50% gap-fill level or below the entire gap, depending on the size of the gap and the volatility of the stock. From there, I target recent pivot highs, new all-time highs, or my favorite target of all, unfilled gaps.
TWLO Daily Chart

Those are exactly the types of setups I am stalking right now.
I would love to see names like PLTR and RDDT consolidate a bit before launching into their next legs higher. Likewise, I would love to see names like RGTI, which I have recently started adding to, gap out of their current ranges and signal that they are ready for another move higher. These are the kinds of charts that tend to produce some of the best risk-to-reward opportunities when they finally resolve to the upside.
The RBLX Setup
I know this may sound strange because I have spent plenty of time sounding off about how bearish RBLX is since its July 31st blow off earnings candle, but RBLX is actually shaping up to be a potentially high-probability trade. The stock is down nearly 75% since then, so I think it is worth a shot.
I reviewed the stock back in mid-May and it looked decent then, but the consolidation that has developed since then is becoming difficult to ignore.
The stock experienced a significant earnings gap lower one month ago. Price then dropped below the earnings candle, trapping bearish breakdown traders, before recovering and moving sideways within the range for the past month. That type of consolidation following a high-volume event often gets my attention.
If RBLX can gap higher from this area, it could create a high-probability trade targeting the earnings gap near $55. Even if we do not get a gap, a breakout above $48.55 is beginning to look pretty decent from a probability standpoint.
Now, to be clear, RBLX remains in a long-term downtrend. However, it is difficult to ignore the volume that came into the stock following the last earnings report. That kind of activity and volume trap is worth paying attention to.
I will be using relatively tight stops if I decide to trade this setup, but as long as price remains above $42.31, the bullish thesis remains intact.
RBLX Daily Chart
