
Whoa, We're Half Way There
RLT Newsletter


Today is July 1st, and we are officially halfway through the year. Time is flying, but the markets are not.
June was a month of consolidation, with both SPY and QQQ closing the month with bearish candles that featured large lower wicks. The “easy” up-only trade that dominated April and May seems to be behind us. We have entered a choppier environment that requires more patience, better stock selection, and a willingness to wait for high-quality setups.
Looking back at previous midterm election years, July has historically been a strong month. In 2010, 2014, 2018, and 2022, July produced solid gains for the broad market. Even in 2006, the month was essentially flat. You have to go all the way back to 2002 to find a truly poor July during a midterm year.
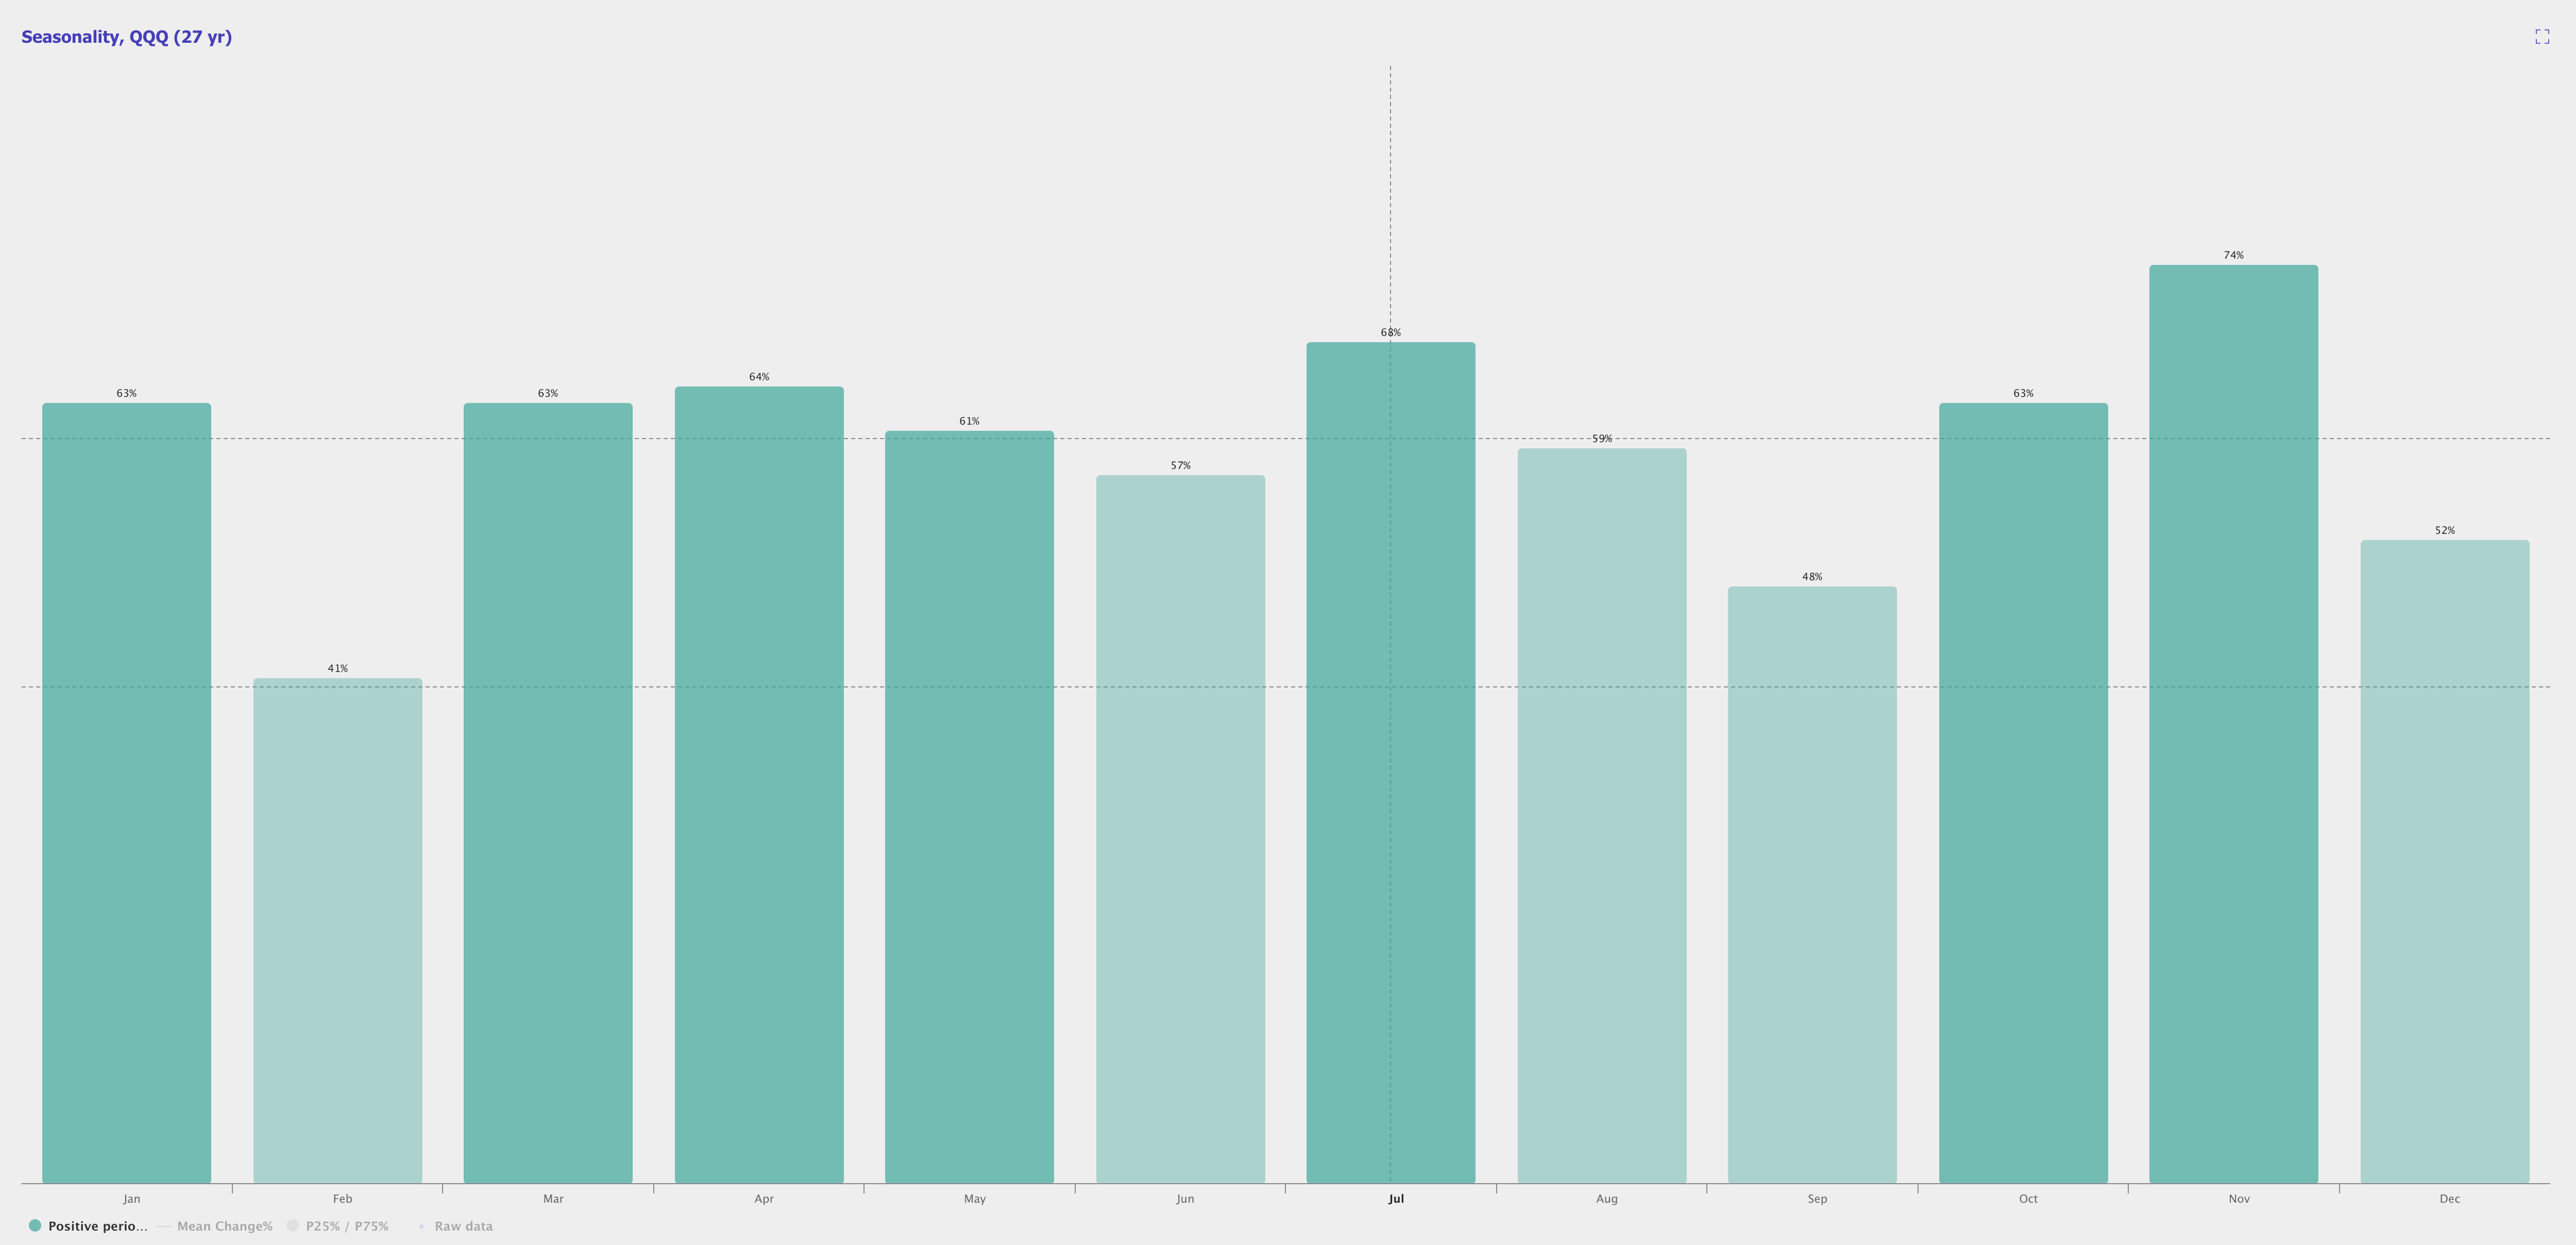
Seasonality continues to favor the bulls. Since its inception, QQQ has finished higher in July 68% of the time, making it the second strongest month of the year behind only November. This is because October often brings increased volatility and selling pressure, followed by strong recoveries in November and December. Based on the current chart patterns, Elliott Wave structure, and seasonality, I think there is a reasonable chance that this market follows a similar script once again.
QQQ Seasonality
The key levels I’m watching for risk management remain unchanged: $702 on QQQ and $725 on SPY. As long as we continue consolidating above those levels, the larger trend and momentum remain bullish. If either level breaks, however, I think we could quickly see a move down toward the 100-day SMA and potentially a retest of the prior all-time highs.
SPY Daily Chart

This week’s price action pushed both SPY and QQQ into last Tuesday’s gap fill before sellers stepped in on Wednesday. SPY continues to trade within a large triangle pattern right at all-time highs, which is exactly the type of environment where choppy price action tends to persist until the market finally resolves the pattern.
If this develops as a standard triangle, I would expect one more push lower in both SPY and QQQ that holds the lower trendline and Point of Control before buyers step back in. That would ideally set up the next leg higher and eventually a breakout above the upper trendline.
On QQQ, I continue to have a major Fibonacci extension target around $665. SPY, on the other hand, has very little Fibonacci resistance until the $800 area, giving it considerable upside potential if this turns into a true summer breakout.
QQQ Daily Chart

Right now, it still feels like capital is simply rotating between sectors, particularly semiconductors and software. When semiconductors sell off, software catches a bid, and then the rotation reverses. For this market to develop into a sustained uptrend, we need broader participation. Multiple sectors have to begin trending higher together rather than simply rotating leadership.
Financials are beginning to do exactly that, which is encouraging. It’s a group I’ve been watching closely since it formed a large double bottom on the weekly chart. Names like WFC, V, and AXP are all starting to look technically strong and could have significantly larger moves ahead.
AXP Daily Chart

The Trillion Dollar Titans are still struggling to regain momentum, but if these leaders can start attracting buyers again, there is plenty of upside runway in names like MSFT, AMZN, META, AVGO, GOOGL, and NVDA.
NVDA Daily Chart

Oil has now filled its February gap around $67.83 and has largely retraced back to where it was before the Iran conflict. I’m certainly not an oil expert or a geopolitical analyst, but I think it’s worth paying attention because XOM is sitting in a very tight consolidation directly on top of its 200-day SMA.
I don’t know which direction this consolidation ultimately resolves, but I do believe the eventual breakout will be worth trading. I initiated a long position near the 200-day SMA. If XOM instead gaps below both the 200-day SMA and the entire consolidation range, I’ll likely flip bearish for a short-term day trade and look to recover the loss. From a purely technical perspective, I think a bounce toward $142 is a very reasonable expectation.
XOM Daily Chart

RDDT is another name I’ve been discussing for quite some time. My focus has primarily been on accumulating shares because the chart has been messy and overlapping while still maintaining a longer-term uptrend.
Wednesday finally produced the type of breakout we’ve been waiting for, as RDDT surged through its 200-day moving average with a powerful bullish candle. I believe there is a high probability that the stock fills the gap near $212, which remains my primary upside target.
If I wanted to add additional exposure, I would use Wednesday’s breakout candle as my reference. A pullback into the 38.2% to 61.8% Fibonacci retracement zone that successfully holds above the 200-day SMA would, in my opinion, offer an attractive risk-to-reward opportunity for a move toward that $212 gap fill.
RDDT Daily Chart
