


Markets were fairly flat overall on Wednesday, with both SPY and QQQ trading mostly within Tuesday’s price action.
Since I have been cautious for the past two months and bearish for the past three weeks, I want to take a look at why I am cautiously bullish in the short term now, even though I still see some significant risks ahead.
The Bear Case
By now, most everyone has seen the 1998, 2018 and 2026 analogs I have been tracking, both of which price has been following incredibly well.
SPY Daily Chart - 2026 Analog
One of the things that initially made me cautious, going back to September 16th, was the historical behavior of new rate-hiking regimes. Looking back through SPY’s history, we have seen six separate rate-hiking regimes begin, and in every single one, the market experienced at least a 7% drawdown from the closing price on the day of the first rate hike in the months that followed.
A 7% drawdown from that level would take SPY back to approximately $700. That would be a perfectly reasonable and healthy correction, bringing the total pullback to around 10%. I will also point out that every single one of those historical drops turned out to be a tremendous buying opportunity. I still think this correction will ultimately be one as well.
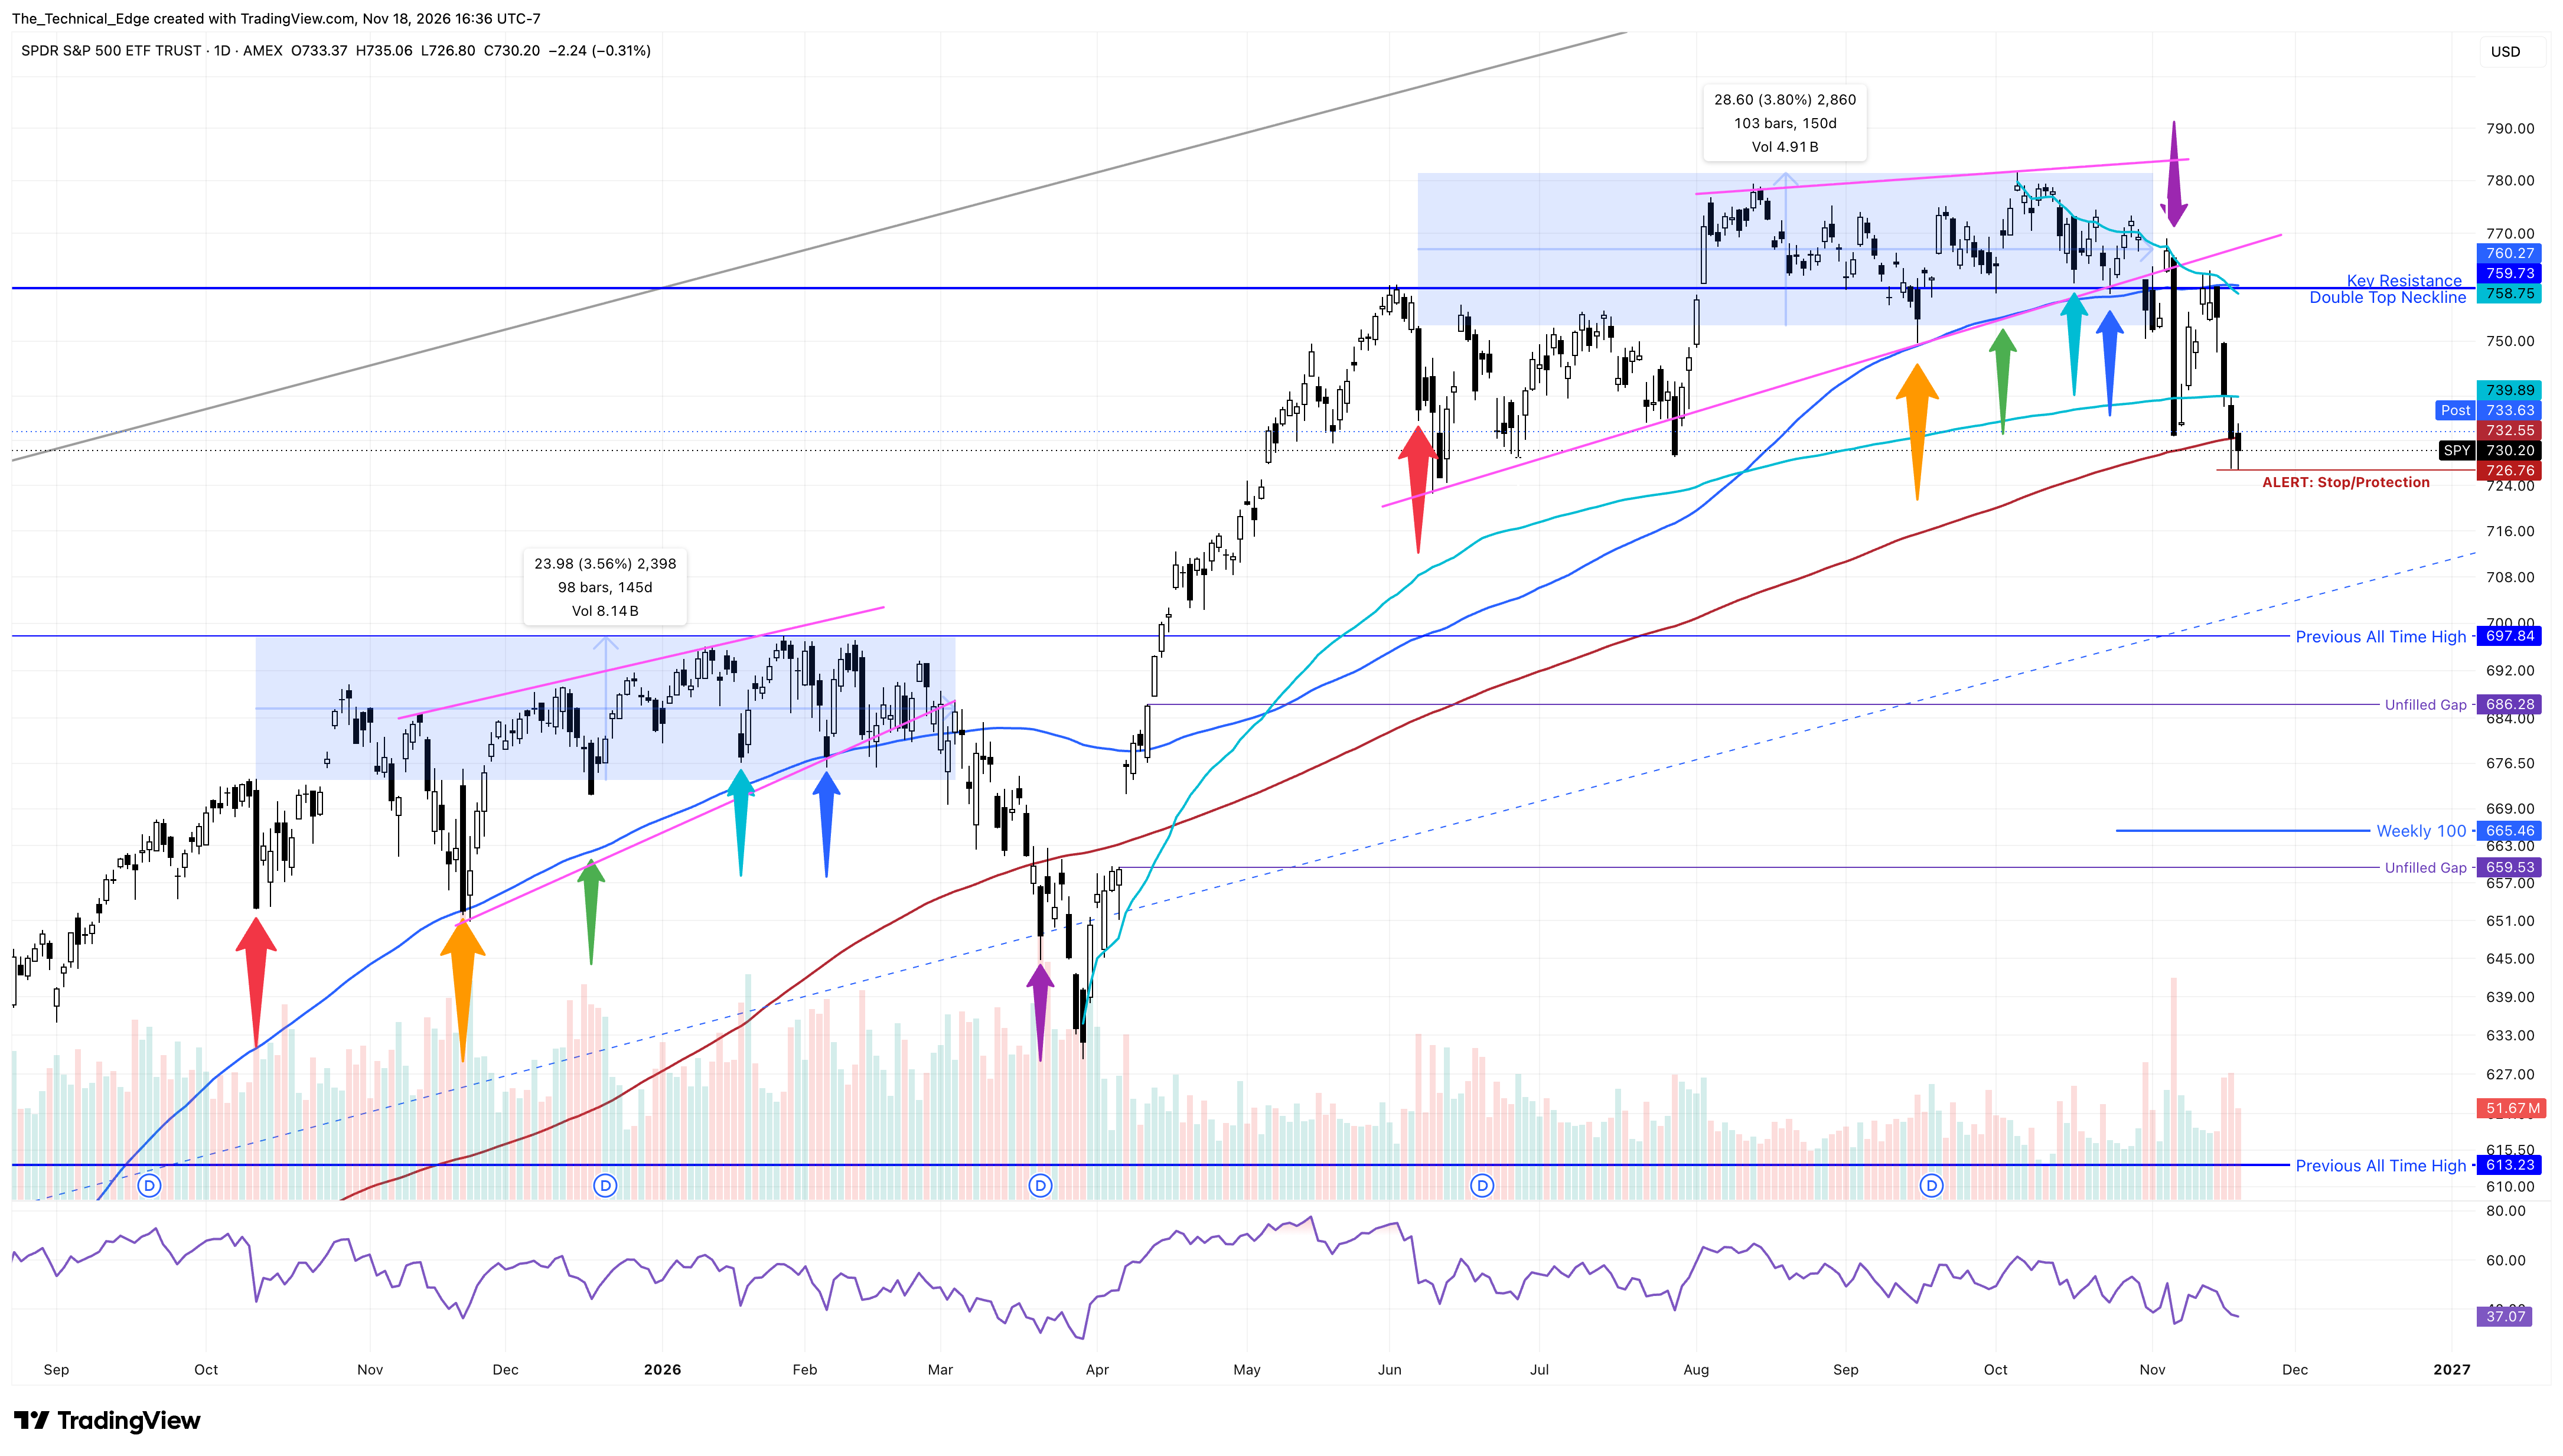
SPY Daily Chart

SPY has now closed below its 200-day SMA, which is a warning sign. However, that does not mean price has to head directly lower. The market often chops around the 200-day SMA before deciding which direction it wants to go.
RSP has also set up an important level, with two bullish candles forming right around its 100-day SMA. A break below that level would not be encouraging. However, it could also signal that rotation is moving back into technology and out of defensive names. That rotation will happen eventually. It is just a matter of when.
RSP Daily Chart

Why I Am Cautiously Bullish in the Short Term
With four consecutive bearish days in both SPY and QQQ, I think it is quite possible we see some kind of bounce here, even if this does not turn out to be a durable low.
The risk/reward to the long side is not bad right now, using Tuesday’s low as an invalidation level and looking for a potential move to fill some of the gaps overhead.
If QQQ can bounce, the next major resistance level will be its 200-day SMA. Interestingly, if we continue following the 2018 analog, that is exactly what could happen. QQQ retests the 200-day SMA from below while SPY chops around its own 200-day SMA. QQQ then fails at that key moving average, followed by SPY making its final flush below the 200-day SMA.
QQQ Daily Chart

What I like about this setup is that even within the bearish scenario, there are opportunities to trade both directions. I can participate in a bounce, trail stops, protect profits, collar or hedge positions, and then potentially make money on the downside if the larger bearish thesis plays out.
I also think sentiment has become overly bearish. There is a tremendous amount of put buying, and the VIX is elevated. It doesn’t seem unreasonable to think we could see another push higher before a final leg lower, assuming that additional drop is still coming.
Speaking of the VIX, during the last two major drawdowns in early 2025 and early 2026, the VIX hit 28, pulled back, and then broke out above 28 as SPY sold off another 10% and 6%, respectively.
If this pullback follows a similar pattern, it would support the possibility of another final leg lower. The good news is that it could be the final flush, setting up what I believe would be a tremendous buying opportunity.
SPY vs VIX

Keep in mind that these final legs lower are often sharp and quick. The final drop in the 1998 analog lasted only three days, while the 2018 decline lasted approximately nine days, depending on where you start counting. The steepest part of the early 2026 pullback lasted only 12 candles, and the sharpest part of the 2025 decline lasted just eight candles.
This is why I am being particularly careful here. Markets can experience some pretty large capitulation moves during these types of corrections, and you really don’t want to be on the wrong side of them.
Relative Strength and Individual Names
Outside of the broad market, which I have spent a tremendous amount of time analyzing lately, I am seeing some interesting pockets of relative strength.
The cybersecurity group is one of the clearest examples. PANW reported earnings Wednesday afternoon and is continuing to push higher in after-hours trading. With those earnings out of the way, and these names continuing to hold key support levels after months of relative strength, I don’t see much reason why they can’t continue pushing higher as long as those levels hold.
CRWD, PANW, FTNT, NET, ZS, and OKTA all look good. I particularly like OKTA and ZS, both of which are bouncing almost perfectly off their 100-day SMAs. FTNT also looks interesting, with plenty of room to the upside after its sharp earnings gap down into the 200-day SMA.
OKTA Daily Chart

I also like the relative strength in AVGO and AMD, as I discussed in “The Huangover Part II.” This is particularly interesting as NVDA’s dominance in the semiconductor space starts to come into question. ANET also put in one of the more textbook candles on Wednesday, providing a very clean level to risk-manage against.
AVGO Daily Chart

With GOOGL, I would really prefer to buy closer to its 100-week SMA, but it doesn’t look like price is going to take a particularly direct path to get there. For now, it continues to hold the anchored VWAP from the April 2025 lows.
GOOGL Daily Chart

Staying Nimble
I am staying pretty nimble here. The risk/reward to the upside is much more obvious in the very short term than it is to the downside, but there are still some very real risks hanging over this market in the medium term.
I am not a permabull or a permabear. I watch key levels, trade against those levels, and manage risk accordingly.